| UNITED STATES |
| SECURITIES AND EXCHANGE COMMISSION |
| Washington, D.C. 20549 |
| SCHEDULE 14A |
| Proxy Statement Pursuant to Section 14(a) of the |
| Securities Exchange Act of 1934 |
| (Amendment No. ) |
| Filed by the Registrant [X] | |||
| Filed by a | |||
| Check the appropriate box: | |||
| [ ] | Preliminary Proxy Statement | ||
| [ ] | Confidential, | ||
| Commission Only (as permitted | |||
| by Rule 14a-6(e)(2)) | |||
| [X] | Definitive Proxy Statement | ||
| [ ] | Definitive Additional Materials | ||
| [ ] | Soliciting Material Under §240.14a-12 | ||
CHESAPEAKE UTILITIES CORPORATION |
| (Name of Registrant as Specified In Its Charter) |
| (Name of Person(s) Filing Proxy Statement, if Other Than the Registrant) |
| Payment of Filing Fee (Check the appropriate box): | ||
| [X] | No fee required. | |
| [ ] | Fee computed on table below per Exchange Act Rules 14a-6(i) | |
| (1) | Title of each class of securities to which transaction applies: | |
| Aggregate number of securities to which transaction applies: | ||
| Per unit price or other underlying value of transaction computed pursuant to Exchange Act Rule 0-11 (set forth the amount on which the filing fee is calculated and state how it was determined): | ||
| Proposed maximum aggregate value of transaction: | ||
| Total fee paid: | ||
| [ ] | Fee paid previously with preliminary materials: | |
| [ ] | Check box if any part of the fee is offset as provided by Exchange Act Rule 0-11(a)(2) and identify the filing for which the offsetting fee was paid previously. Identify the previous filing by registration statement number, or the | |
| (1) | Amount previously paid: | |
| Form, Schedule or Registration Statement No.: | ||
| Filing Party: | ||
| Date Filed: | ||


Notice of 2017Virtual 2020 Annual Meeting of Stockholders
April 10, 2017
7, 2020
Dear Stockholder,
On May 3, 2017,7, 2020, Chesapeake Utilities Corporation (the "Company") will be holdinghold its 20172020 Annual Meeting of Stockholders (the "Meeting"). Due to the emerging public health impact of the coronavirus outbreak (COVID-19), and out of concern for the health and safety of our stockholders, directors, and members of management, the Meeting will be held in a virtual meeting format only. There will be no physical location for stockholders to attend the Meeting. Stockholders will be able to listen, vote and submit questions. If you plan to participate in the virtual Meeting, please see the Instructions for the Virtual Annual Meeting section in the attached Proxy Statement. Stockholders may participate in the Meeting by logging in at www.virtualshareholdermeeting.com/CPK2020. Stockholders of record at the close of business on March 10, 20172020 will be asked to:
| Proposal | Board Recommendation | |
| FOR each nominee | ||
| Proposal 2 | Non-binding advisory vote to approve the compensation of the Company's |
| Named Executive Officers | FOR | |
| FOR |
Stockholders will also transact any other business that is properly brought before the Meeting and at any adjournment or postponement of the Meeting. For any other business that is properly brought before the Meeting, the appointed proxies are authorized to vote pursuant to their discretion.
Your vote is important and we encourage you to vote as soon as possible even if you plan to attendparticipate in the virtual Meeting. Please read the attached Proxy Statement for additional information on the matters youwe are being askedasking you to vote on.

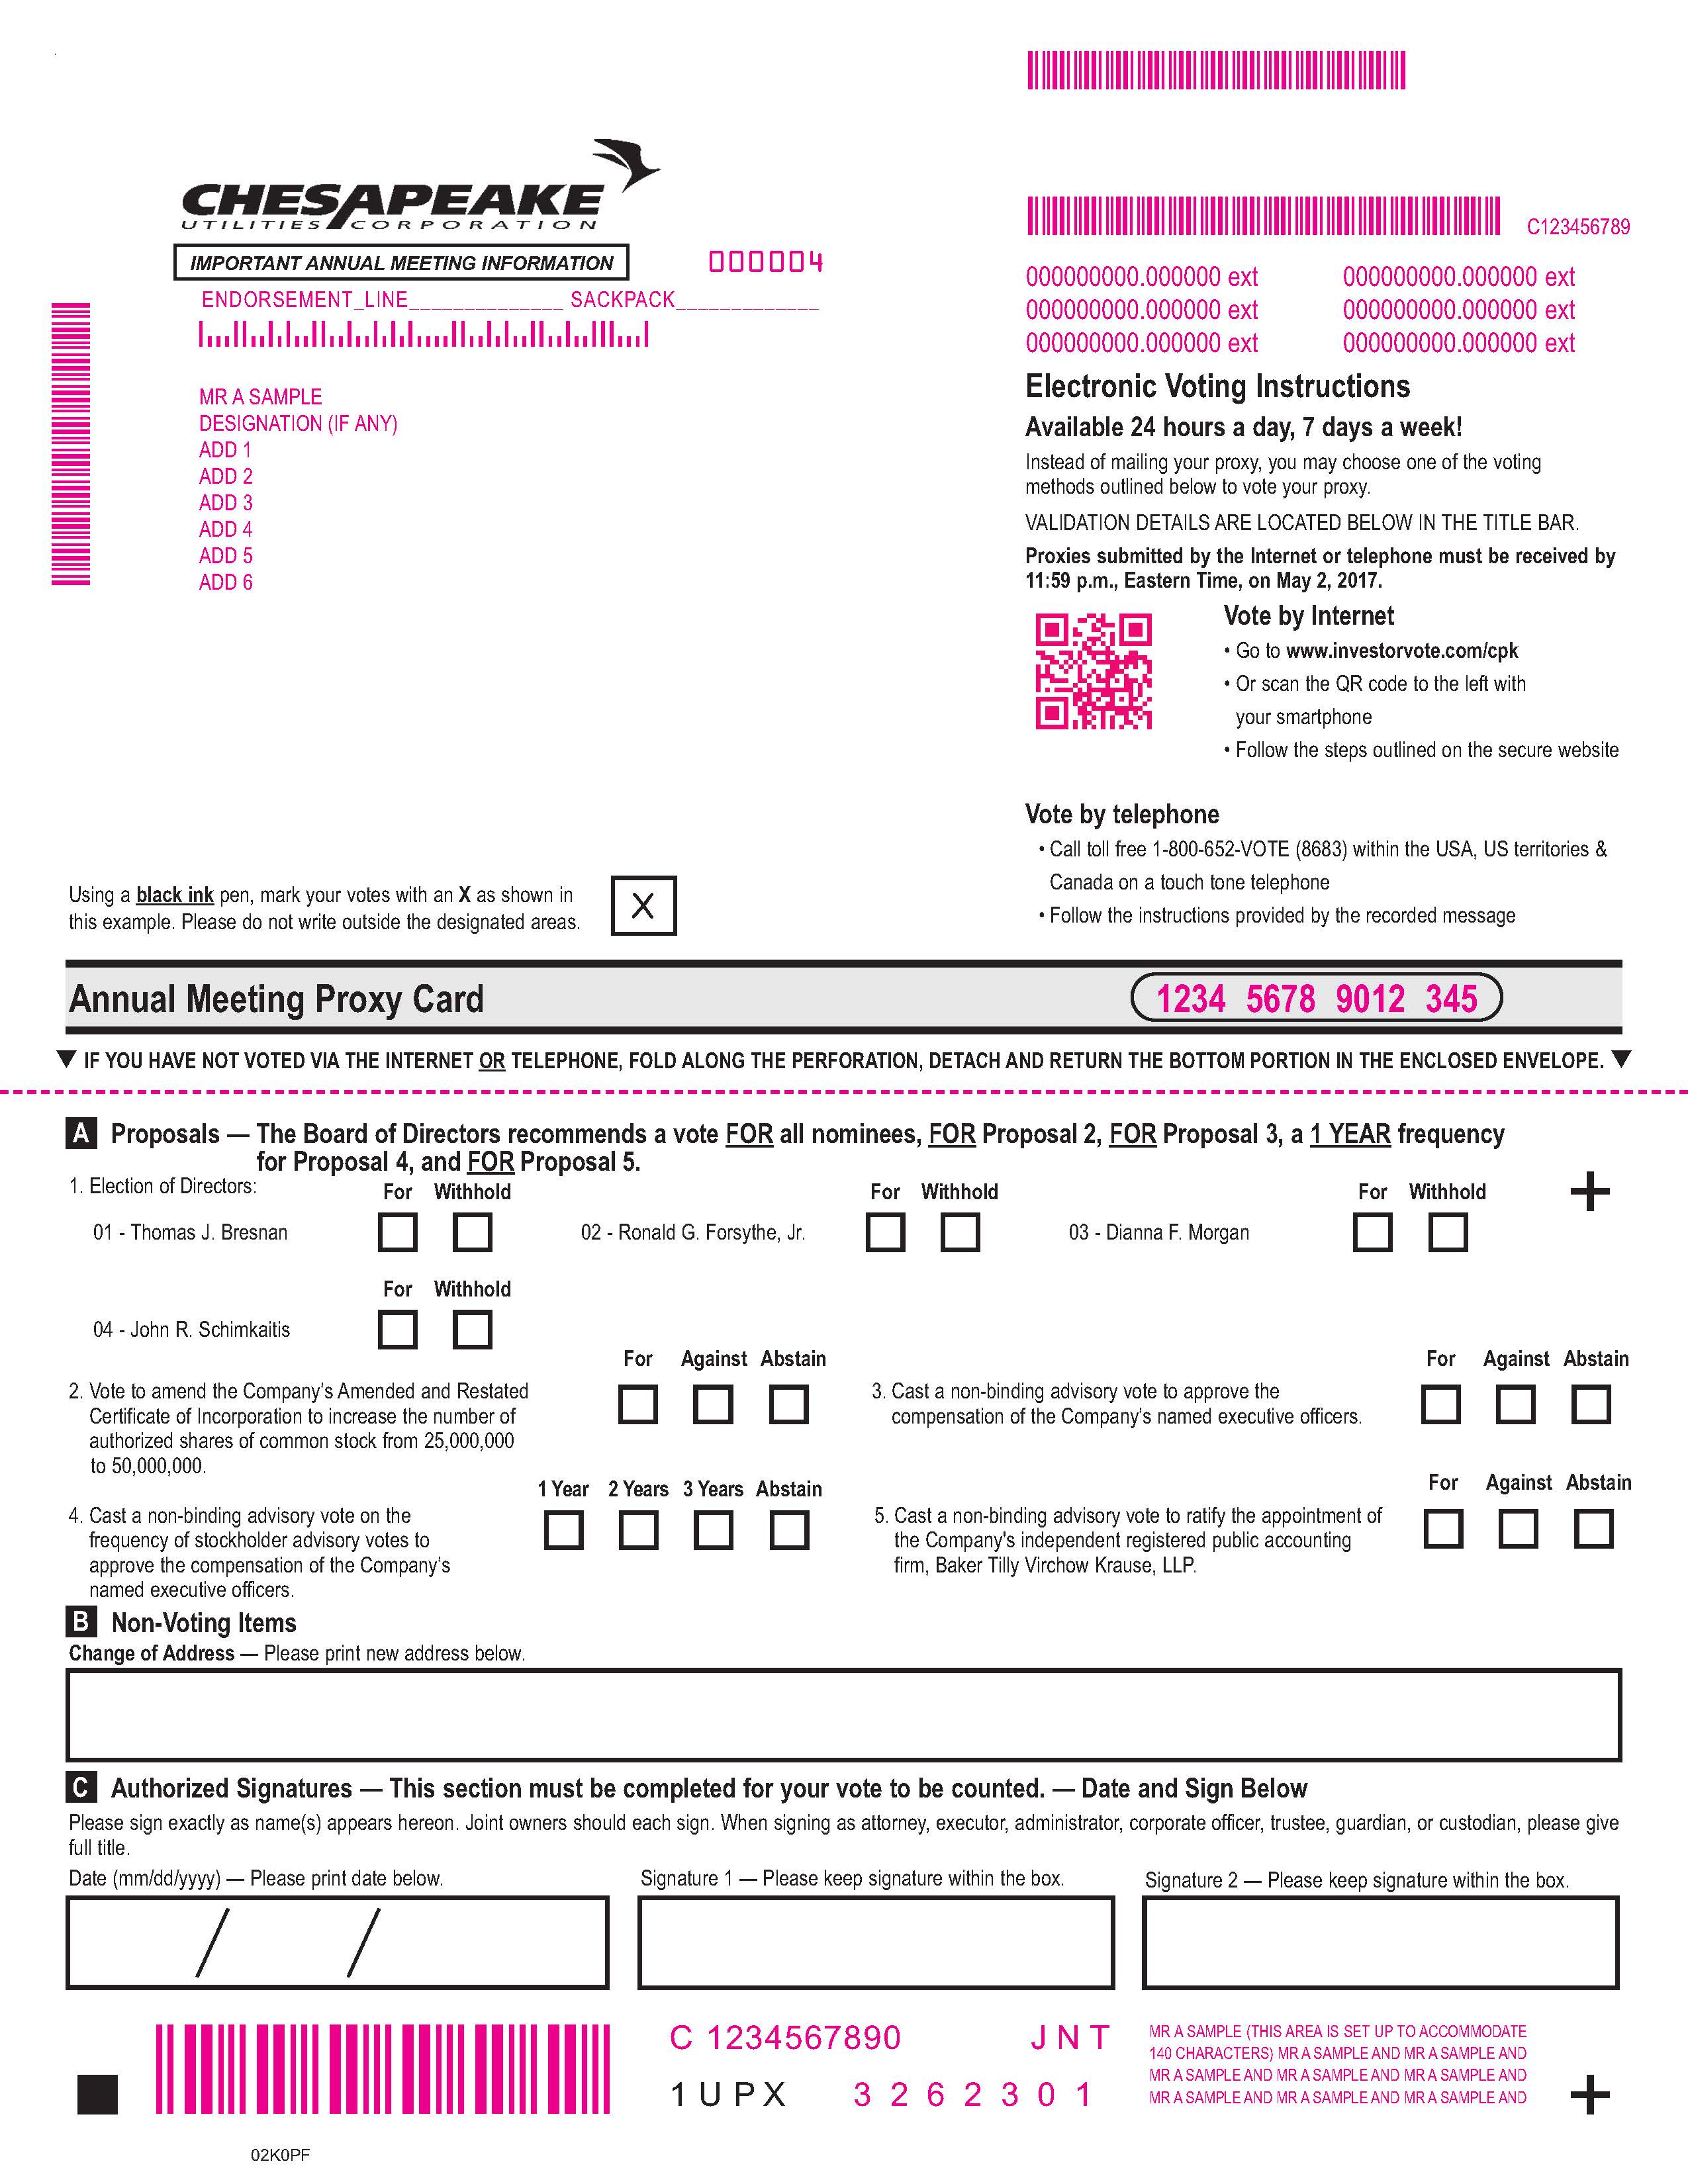
| Internet | Type www.proxyvote.com in your internet browser and enter the control number on your proxy card. | |
| Mobile Device | Scan the QR code on your proxy card with your mobile device and enter the control number on your proxy card. | |
| Telephone | Dial toll free (800) 690-6903 to reach our agent and follow the telephone prompts. | |
| Cast your ballot, sign and date your proxy card, and mail it in the enclosed envelope. | ||
If you own shares through your bank, broker or other institution or in an account established under one of the Company’s deferred compensation plans,Retirement Savings Plan, Deferred Compensation Plan, or other plan, you will receive separate instructions on how you can vote the shares you own in those accounts.
Thank you for your investment in Chesapeake Utilities Corporation.
Sincerely,

James F. Moriarty
and Chief Policy and Risk Officer
Important Notice Regarding the Availability of Proxy Materials. This Notice for the Virtual 2020 Annual Meeting of Stockholders to be held on May 3, 2017,7, 2020, the attached Proxy Statement (which includes instructions for attending our 2016virtual Annual Meeting), and our 2019 Annual Report on Form 10-K and directions to the Annual Meeting are available at www.chpk.com/proxymaterials.www.chpk.com/proxymaterials.
909 Silver Lake Boulevard, Dover, DE 19904 ▪ www.chpk.com ▪ (888) 742-5275

| 1 | Proxy Statement | ||
| 2 | Proposals | ||
| 3 | Audit Related Matters | ||
| 4 | Board of Directors and Its Committees | ||
| 5 | Corporate Governance and Stock Ownership | ||
| 6 | Our Engaging Culture | ||
| 7 | Director and Executive Compensation | ||
| 8 | Other Important Information | ||
GLOSSARY OF TERMS
| Statement. | ||
| 2015 Cash Plan: | The Company's Cash Bonus Incentive Plan as approved by our stockholders in May 2015 | |
| 2017 Equity Incentive Award: | An equity incentive award granted by the Compensation Committee pursuant to the SICP for the 2017-2019 performance period | |
| An equity incentive award granted by the Compensation Committee pursuant to the SICP for the 2018-2020 performance period | ||
| 2019 Equity Incentive Award: | An equity incentive award granted by the Compensation Committee pursuant to the SICP for the 2019-2021 performance period | |
| Aspire Energy: | Aspire Energy of Ohio, LLC, a wholly-owned subsidiary of Chesapeake Utilities | |
| Baker Tilly: | Baker Tilly Virchow Krause, LLP, the Company's independent registered public accounting firm, or our external audit firm | |
| Bylaws: | ||
| Bylaws, as amended through May 8, 2019 | ||
| Board: | ||
| Cash Incentive Award: | ||
| pursuant to the 2015 Cash Plan for the 2019 performance period | ||
| Chesapeake Utilities or Company: | Chesapeake Utilities Corporation, its divisions and subsidiaries, as appropriate in the context of the disclosure | |
| FW Cook: | Frederic W. Cook & Co., Inc., the Compensation Committee's independent compensation consultant | |
| Deferred Compensation Plan: | A non-qualified, deferred compensation plan under which compensation may be deferred by eligible participants | |
| Delmarva Peninsula: | A peninsula on the east coast of the U.S. occupied by Delaware and portions of Maryland and Virginia | |
| Dodd-Frank Act: | The Dodd-Frank Wall Street Reform and Consumer Protection Act | |
| EPS: | Basic earnings per share (GAAP unless otherwise noted) | |
| Exchange Act: | The Securities Exchange Act of 1934, as amended | |
| FASB: | Financial Accounting Standards Board | |
| FPU: | Florida Public Utilities Company, a wholly-owned subsidiary of Chesapeake Utilities | |
| IRS: | Internal Revenue Service | |
| Marlin Gas Transport: | Marlin Gas Transport, Inc., a wholly-owned subsidiary of Chesapeake Utilities | |
| Named Executive Officer, NEO, or Executive NEO: | Individuals as defined in Item 402(a)(3) of Regulation S-K are collectively referred to as "Named Executive Officers" or "NEOs." Four NEOs that currently serve as Executive Officers of the Company are collectively referred to as "Executive NEOs." | |
| NYSE: | New York Stock Exchange | |
| Public Company Accounting Oversight Board | ||
| Pension Plan: | A defined benefit pension plan sponsored by the Company | |
| Pension SERP: | An unfunded supplemental executive retirement pension plan sponsored by the Company | |
| PESCO: | Peninsula Energy Services Company, Inc., a wholly-owned subsidiary of Chesapeake Utilities | |
| The Company's qualified 401(k) retirement savings plan | ||
| ROE: | Return on equity | |
| SEC: | Securities and Exchange Commission | |
| SICP: | The Company's 2013 Stock and Incentive Compensation Plan | as approved by our stockholders in May 2013 and amended by the Compensation Committee of the Board in January 2017 |
| TSR: | ||
| Total shareholder return | ||

Enclosed are the proxy materials that describe each matter to be voted on by the stockholders, and information on the Company and its practices. The Notice of Virtual 2020 Annual Meeting of Stockholders, this Proxy Statement, and the enclosed Proxy Card are being furnished to our stockholders on or about April 7, 2020. We ask that you review each matter to be voted on at the Meeting and vote your shares using the methods described in this Proxy Statement. We thank you for your investment in the Company.
Summary of Proposals and Board Recommendations
This summary is an overview of information that you will receive separate instructions on howfind elsewhere in this Proxy Statement. This summary does not contain all of the information that you can voteshould consider, and you should read the shares you own in those accounts.entire Proxy Statement carefully before voting. With regard to Proposal 1, if elected, directors are subject to the Company’s Bylaws, including the current age eligibility requirement.
| Proposal Number | Description | Board of Directors' Vote Recommendation |
| 1 | Election of one Class II director for a two-year term ending in 2022 and election of four Class III directors | FOR each nominee |
| 2 | ||
Non-binding advisory vote to approve the compensation of the Company's | FOR | |
| Non-binding advisory vote to ratify the appointment of the | FOR | |
| Name | Age | Director Since | Principal Occupation | Independent | Committee Memberships | Experience and Skills |
| Thomas J. Bresnan | 64 | 2001 | Owner and President, Accounting and Business School of the Rockies and Denver Accounting Services | Yes | Chair, Audit Committee Member, Investment Committee | • Executive Management• Sales and Marketing• Technology• Financial Expert |
| Ronald G. Forsythe, Jr. | 48 | 2014 | President and Chief Executive Officer, Quality Health Strategies | Yes | Member, Audit Committee | • Technology• Market Knowledge andEconomic Development (Delmarva Peninsula) • Organizational Positioning• Financial Expert |
| Dianna F. Morgan | 65 | 2008 | Former Senior Vice President of Public Affairs and Human Resources, Walt Disney World Company | Yes | Chair, Compensation Committee | • Leadership Development and Organizational Culture• Customer Experience• Media Relations• Government Relations |
| John R. Schimkaitis | 69 | 1996 | Chair of the Board of Directors, Chesapeake Utilities Corporation | Yes | Chair, Investment Committee | • Executive Management• Leadership Development• Energy Industry• Market Knowledge (Delmarva Peninsula and Florida) |
| Class II Director | Age | Director Since | Principal Occupation | Independent | Committee Memberships | Experience and Skills |
| Lila A. Jaber | 53 | 2020 | President, Jaber Group Inc. | Yes | – | • Extensive experience in strategy, ethics, and government affairs • Established relationships with colleagues and members of the business and political community throughout Florida • In-depth knowledge of the energy industry and regulatory policy |
CHESAPEAKE UTILITIES CORPORATION - 2020 Proxy Statement - 1
| Class III Directors | Age | Director Since | Principal Occupation | Independent | Committee Memberships | Experience and Skills |
| Thomas J. Bresnan | 67 | 2001 | Owner & President, Career School of the Rockies and Denver Accounting Services | Yes | Audit Committee Chair Investment Committee Member | • Extensive leadership, technology, sales and marketing experience • In-depth experience in acquisitions and the post integration process • Financial and Audit Committee expertise |
| Ronald G. Forsythe, Jr. | 51 | 2014 | Chief Executive Officer, Qlarant Corporation | Yes | Audit Committee Member Compensation Committee Member | • Extensive experience in leadership, organizational positioning, energy, community engagement, and technology including cyber security • Established relationships with colleagues and members of the community throughout the Delmarva Peninsula • Financial and Audit Committee expertise |
| Dianna F. Morgan | 68 | 2008 | Former Senior Vice President, Walt Disney World Co. | Yes | Compensation Committee Chair Corporate Governance Committee Member | • Extensive public company, leadership development, and organizational culture experience • Expertise in human capital, public affairs and the customer experience • In-depth knowledge in media relations and government relations |
| John R. Schimkaitis | 72 | 1996 | Retired President and Chief Executive Officer, Chesapeake Utilities Corporation | Yes | Investment Committee Member | • Extensive financial, regulatory and industry experience • Extensive leadership and strategic foresight evidenced by our growth from $95 million market capitalization at the end of 1999 to approximately $395 million at the end of 2010 • In-depth knowledge of the markets in Florida and on the Delmarva Peninsula |
PROPOSAL 2: With respect to Amend the Company’s Amended and Restated Certificate of Incorporation to Increase the Number of Authorized Shares of Common Stock from 25,000,000 to 50,000,000
The Compensation Committee focuses on aligning total compensation of our executive officers with our business objectives, thereby increasing stockholder value. Total compensation is comprised of: (i) base salary, which is a fixed element of compensation and is set at levels to attract and retain executive officers with skills and qualities that align with our culture and strategic goals, and (ii) short-term cash and long-term equity incentive compensation, which are two at-risk elements of compensation that incentivize executive officers based upon the achievement of pre-established financial and non-financial performance metrics over an annual period (in the case of the short-term cash incentive awards), and pre-established financial metrics over a three-year performance period (in the case of the long-term equity incentive awards).
Our compensation practices include the following:
The Compensation Committee is comprised of independent directors who retain discretion over the administration of our executive compensation program and discretion in determining the achievement of performance
The Compensation Committee retains an independent compensation consultant who advises on our executive compensation program and other matters
The Compensation Committee annually reviews the executive compensation program to ensure alignment with the Company's objectives
CHESAPEAKE UTILITIES CORPORATION - 20172020 Proxy Statement - ii2
The executive compensation program uses multiple performance measures that focus on both short-term performance, as well as long-term execution of our strategic plan, and features a cap on the maximum amount that can be earned for any performance period
The Compensation Committee considers peer group and benchmarking data in its review of the executive compensation program
Executive compensation is tied to performance, thereby aligning a significant portion of compensation with the interests of stockholders
Executive officers are evaluated using a variety of quantitative metrics, including TSR relative to a peer group under the long-term incentive plan
Executive officers are subject to a compensation recovery policy
Executive officers participate in the same benefits that are available to other employees, have a cap on their life insurance benefit, and receive no perquisites other than a Company vehicle that is available for personal use, but which is treated as compensation
Executive officers do not receive excise tax gross-up protections
Executive officers receive dividends on equity incentive awards only to the extent the awards are earned and in proportion to the shares actually earned
Executive officers may not engage in hedging transactions and may not pledge any Company stock
Executive officers are subject to a double-trigger change-in-control vesting provision under the SICP
| Types of Fees | 2016 | 2015 | |||||
| Audit Fees | $ | 846,249 | $ | 767,176 | |||
| Audit-Related Fees | $ | 80,183 | $ | 54,238 | |||
| Tax and Other Fees | $ | 0 | $ | 0 | |||
(remainder of page left intentionally blank)
CHESAPEAKE UTILITIES CORPORATION - 20172020 Proxy Statement - iii3
Meeting Time, Date and Location
The Meeting will be held at 9:00 a.m. Eastern Time on Wednesday,Thursday, May 3, 2017,7, 2020. The Meeting will be held in a virtual meeting format only. If you plan to participate in the Board Room of PNC Bank, N.A., 222 Delaware Avenue, 18virtual Meeting, please see the thInstructions for the Virtual Annual Meeting Floor, Wilmington, Delaware 19801.section in this Proxy Statement. Stockholders may participate in the Meeting by logging in at www.virtualshareholdermeeting.com/CPK2020. There will be no physical location for shareholders to attend the Meeting.
Who May Vote
Holders of the Company's common stock at the close of business on March 10, 2017,2020, the record date established by the Board, are entitled to vote at the Meeting. ThereAs of the record date, there were 16,331,88916,422,459 shares of our common stock outstanding as of this date.outstanding. These shares of common stock are our only outstanding class of voting equity securities. Each share of common stock is entitled to one vote on each matter submitted to the stockholders for a vote. The namedCompany's executive officers and directors, of the Company, collectively, have the power to vote 4.16 percent3.14% of these shares.
Proposals Requiring Your Vote
The named executive officersproposals to be voted on at the Meeting are provided below, along with the required vote for each proposal to be adopted, and the effect of abstentions and broker non-votes on each proposal. The Executive NEOs (as defined in the Glossary of Terms herein) and directors intend to vote their shares of common stock as follows:FOR each nominee in Proposal 1 and FOR each of Proposals 2 and 3. With regard to Proposal 1, if elected, directors are subject to the Company’s Bylaws, including the current age eligibility requirement.
| Proposal | Description of Proposal | Board Recommendation | Vote | Effect of Abstentions | Effect of Broker Non-Votes |
| Proposal 1 | Election of one Class II director for a two-year term ending in 2022 and election of four Class III directors | FOR each nominee | Plurality of the votes cast by the holders of shares present at the Meeting or represented by proxy and entitled to vote at the Meeting | No effect | No effect |
| Proposal 2 | |||||
| Non-binding advisory vote to approve the compensation of the Company's | FOR | ||||
| No effect | |||||
| Non-binding advisory vote to ratify the appointment of the | FOR | Approved, on a non-binding advisory basis, if a majority of the shares present at the Meeting or represented by proxy and entitled to vote support the proposal | Treated as votes against proposal | Brokers have discretion to vote | |
The appointed proxies will vote pursuant to their discretion on any other matter that is properly brought before the Meeting and at any adjournment or postponement of the Meeting in accordance with our Amended and Restated Bylaws, as amended (the "Bylaws").Bylaws. The Company is not aware of any other matter to be presented at the Meeting.
Instructions for the Virtual Annual Meeting
Participating in the Virtual Meeting.Due to the emerging public health impact of the coronavirus outbreak (COVID-19), this year's Meeting will be a virtual meeting. There will be no physical meeting location. A virtual meeting format offers the same participation opportunities as those opportunities available to stockholders at in-person meetings. Stockholders will be able to listen, vote and submit questions. To participate in the Meeting visit www.virtualshareholdermeeting.com/CPK2020 using your desktop or mobile device and enter the control number included on your proxy card. Once you login to www.virtualshareholdermeeting.com/CPK2020 and enter the
CHESAPEAKE UTILITIES CORPORATION - 2020 Proxy Statement - 4
control number included on your proxy card, you may submit a question until the adjournment of the Meeting. Only questions pertinent to matters related to the Meeting will be answered during the Meeting, subject to time constraints. Any questions pertinent to matters related to the Meeting that cannot be answered during the Meeting due to time constraints will be responded to by management either telephonically or by email communication. The virtual platform for the Meeting is supported across numerous browsers. The Meeting will begin promptly at 9:00 a.m. Eastern Time on May 7, 2020. If you need technical assistance with the meeting platform when logging into the Company's virtual Meeting or prior to adjournment of the Meeting, please call the dedicated technical support number provided at www.virtualshareholdermeeting.com/CPK2020. Representatives will be available beginning at 8:30 a.m. Eastern Time. A recording of the Meeting will not be available after the adjournment of the Meeting.
Voting Instructions
Stockholders of Record.Record. If you are a registered stockholder, your proxy card will be voted at the Meeting if it is properly submitted and not subsequently revoked. If your proxy card is incomplete or if you do not provide instructions with respect to any of the proposals, the appointedyour proxy card will be voted in line with management's and the Board's recommendation for each Proposal and pursuant to the appointed proxy's discretion for any other business properly brought before the Meeting. If your proxy card is unclear as to how you intended to vote (e.g., multiple selections are made for one proposal), your proxy will be voted pursuant to the discretion of the appointed proxy.
Beneficial OwnershipOwnership.. If you held shares of our common stock through a bank, broker, trustee, nominee, or other institution (called “street name”) on March 10, 2017,2020, you are entitled to vote on the matters described in this Proxy Statement. You will receive this Proxy Statement, any other solicitation materials, and voting instructions through your bank, broker, trustee, nominee, or institution. If you do not provide voting instructions, your shares may constitute “broker non-votes” on certain proposals. Generally, broker non-votes occur on a non-routine proposal where a broker is not permitted to vote on that proposal without instructions from the beneficial owner. Broker non-votes are counted as present for purposes of determining whether there is a quorum, but are not counted for purposes of determining whether a matter has been approved. If you properly submit a proxy card, but do not provide voting instructions, your institution will not be permitted to vote your shares on Proposal 1 - election of directors and Proposal 2 - amendment to the Company's Amended and Restated Certificate of Incorporation, Proposal 3 -non-binding advisory vote to approve the compensation of the Company's named executive officers, and Proposal 4 - advisory vote on the frequency of "say-on-pay" votes to approve the compensation of the Company's named executive officers; however,Named Executive Officers. However, your institution will be able to vote your shares on Proposal 53 - non-binding advisory vote to ratify the appointment of our independent registered public accounting firm. As a result, if you do not provide voting instructions to your institution, your shares will have no effect on the outcome of Proposals 1 2, 3, and 4. We will reimburse the institution for reasonable expenses incurred in connection with their solicitation.2. If you plan to virtually attend the Meeting, you will need to bringreceive a valid proxy from theyour institution if you intend to vote your shares at the Meeting.
Methods Available Forfor Voting
Your vote is important and we encourage you to vote as soon as possible, even if you plan to virtually attend the Meeting. You may virtually attend the Meeting and electronically deliver your proxy card in person before voting is declared closed at the Meeting. You may vote at the Meeting even if you submitted your proxy using any of the methods below. Each of these voting methods are available 24/7 for your convenience. Please have your Proxy Card available when voting.

| Internet | Type www.proxyvote.com in your internet browser and enter the control number on your proxy card. | |
| Mobile Device | Scan the QR code on your proxy card with your mobile device and enter the control number on your proxy card. | |
| Telephone | Dial toll free (800) 690-6903 to reach our agent and follow the telephone prompts. | |
| Cast your ballot, sign and date your proxy card, and mail it in the enclosed envelope. | ||
If you own shares through your bank, broker or other institution or in an account established under one of the Company’s deferred compensation plans,Retirement Savings Plan, Deferred Compensation Plan, or other plan, you will receive this Proxy Statement, other solicitation materials, and voting instructions from your representative on how you can vote the shares you own in those accounts. We will reimburse the institutions for reasonable expenses incurred in connection with their solicitation.
Signing the Proxy - Stockholder Representatives or Joint Stockholders
If you are an authorized officer, partner or other agent voting shares on behalf of a corporation, limited liability company, partnership or other legal entity, you should sign the accompanying proxy card in the entity name and indicate your name and title. If you are an agent, attorney, guardian or trustee submitting a proxy card on behalf of a registered stockholder, you should also indicate your title with your signature. If you own stock with multiple parties, each party should sign the proxy card. If stock is registered in the name of a decedent and you are an executor, or an administrator, of the decedent’s estate, you should sign the accompanying proxy card, indicate your title following your signature, and attach legal instruments showing your qualification and authority to act in this capacity.
CHESAPEAKE UTILITIES CORPORATION - 20172020 Proxy Statement - 25
| Proposal | ELECTION OF DIRECTORS |
| 1 | The Board recommends a vote FOR each of the director nominees. The Board, upon recommendation of the Corporate Governance Committee, nominated five incumbent directors - Thomas J. Bresnan, Ronald G. Forsythe, Jr., Lila A. Jaber, Dianna F. Morgan and John R. Schimkaitis. The Board has a diverse combination of leadership, professional skills, and experience that support our business and long-term strategic focus. |
Board Composition and Voting
General InformationInformation.. As of the date of this Proxy Statement, the entire Board consists of teneleven directors divided into three classes. Directors are elected to serve three-year terms. Directors are electedterms by a plurality of the votes cast by the holders of the shares present in personat the Meeting or represented by proxy and entitled to vote at the Meeting. In December 2015, the Board amended the Company’sOur director resignation policy, which is set forth in our Corporate Governance Guidelines, to adoptapplies when a director resignation policy that would apply in cases where a nominee for director receives more “withheld”“withhold” votes than votes “for” his or her electionvotes in an uncontested director election at a stockholder meeting. The Corporate Governance Guidelines are available at www.chpk.com/our-company/corporate-governance/.
Voting for Director Nominees.Each share of our common stock is entitled to one vote. You may authorize a proxy to vote your shares on the election of directors. A proxy that withholds authority to vote for a particular nominee will count neither for nor against the nominee.
Director NominationsNominations. . TheOn November 6, 2019, the Board increased the size of the Board from ten to eleven directors and appointed Lila A. Jaber to fill the resulting vacancy, effective January 1, 2020. Pursuant to the Company’s Bylaws a director chosen to fill a vacancy holds office until the next annual meeting of stockholders, at which such director will be nominated for election. On February 26, 2020, the Board confirmed the size of the Board at eleven directors and upon recommendation of the Corporate Governance Committee has nominated fourthe following five incumbent directors -directors: i) Lila A. Jaber to serve as a Class II director until the 2022 Annual Meeting of Stockholders and until her successor is elected and qualified, and ii) Thomas J. Bresnan, Ronald G. Forsythe, Jr., Dianna F. Morgan and John R. Schimkaitis. If elected, these directors willSchimkaitis to serve as Class III directors until the 20202023 Annual Meeting of Stockholders and until their successors are elected and qualified. If elected, directors are subject to the Company’s Bylaws, including the current age eligibility requirement. Also, if prior to the election, any of the nominees become unable or unwilling to serve as a director of the Company, (an eventuality that we do not anticipate), all proxies will be voted for any substitute nominee who may be designated by the Board pursuant tobased on the recommendation of the Corporate Governance Committee. The Company’s Bylaws provide the framework for director nominations and director eligibility for election or re-election as a director of the Company.
Director Family Relationships. There are no family relationships among any of our directors, nominees for directors, or executive officers.
Director Biographies, Key Attributes, Experience and Skills.Descriptions of the director nominees and continuing director's principal occupation and employment, principal business, affiliations, and other business experience during the past five years are provided beginning on the next page.
CHESAPEAKE UTILITIES CORPORATION - 20172020 Proxy Statement - 36
DIRECTOR NOMINEE - CLASS II - TERM EXPIRES IN 2022 If elected, directors are subject to the Company’s Bylaws, including the current age eligibility requirement. | |||
 | LILA A. JABER | ||
Ms. Jaber is President of Jaber Group Inc., a consulting firm. Ms. Jaber retired in 2019 from Gunster Yoakley & Stewart, P.A. where she served as Gunster's regional managing shareholder having led the regulatory law and legislative government affairs practice in Florida and assisted in developing the firm’s presence in Central and North Florida. Ms. Jaber was appointed by the Governor to serve two terms (1995-2005), initially as Commissioner, and then Chair of the Florida Public Service Commission overseeing the state’s implementation of economic regulatory policy and procedures for the energy and natural gas industries. In 2015, Ms. Jaber launched Florida’s Women in Energy Leadership Forum to celebrate the success of women leaders in the energy industry and their role in growing Florida’s economy and diversified workforce. A life-long servant leader, Ms. Jaber serves as a trustee on the Stetson University Board of Trustees, is past chair of Leadership Florida, former vice-chair and founding member of the Big Bend Minority Chamber of Commerce, and past inaugural chair of the City of Tallahassee’s Independent Ethics Board. Ms. Jaber was named the 2019 Lifetime Advocacy honoree by the Big Bend Minority Chamber of Commerce, received the Tallahassee Women Lawyers Diversity & Inclusion Award, and in 2016, received the commission of Kentucky Colonel by Kentucky’s Governor. | |||
Director since 2020 Independent Director Age 53 | |||
Key Attributes and Skills: •Extensive experience in strategy, ethics, and government affairs •Established relationships with colleagues and members of the business and political community throughout Florida •In-depth knowledge of the energy industry and regulatory policy | |||
DIRECTOR NOMINEES - CLASS III - TERMS EXPIRE IN 2023 If elected, directors are subject to the Company’s Bylaws, including the current age eligibility requirement. | |||
 | THOMAS J. BRESNAN | ||
Mr. Bresnan is an entrepreneur who owns and has served as President of the Career School of the Rockies, and also of Denver Accounting Services since 2012 and 2014, respectively. He served as President of Global LT, a language and cross-cultural training company from 2017 until 2019 and has served as a member of its Board since 2014. From 2008-2012, Mr. Bresnan served as a majority stockholder, President and Chief Executive Officer of Schneider Sales Management, LLC. He previously served as a member of the Board, and President and Chief Executive Officer of New Horizons Worldwide, Inc., an information technology training company. He has also served as President of Capitol American Life Insurance, Chief Financial Officer at Capitol American Finance, and has held positions at Arthur Andersen & Co. | |||
Director since 2001 Independent Director Age 67 Audit Committee Chair and Financial Expert Investment Committee Member | |||
Key Attributes and Skills: •Extensive leadership, technology, sales and marketing experience •In-depth experience in acquisitions and the post integration process •Financial and Audit Committee expertise | |||
CHESAPEAKE UTILITIES CORPORATION - 2020 Proxy Statement - 7
 | RONALD G. FORSYTHE, JR. | ||
| Dr. Forsythe has served as Chief Executive Officer of Qlarant Corporation since July 2015. Qlarant Corporation previously operated as Quality Health Strategies until its comprehensive rebranding and new name formation in February 2018. He served as President of Quality Health Strategies from July 2015 until February 2018 and as its Chief Operating Officer from 2012-2015. He previously served as Chief Information Officer and Vice President of Technology and Commercialization at the University of Maryland Eastern Shore, and as an IT consultant for a large water and wastewater utility. He has served as a member of the Regional Advisory Board of Branch Banking and Trust Company, the Board of the Peninsula Regional Medical Center Foundation, and on the Higher Education Advisory Boards for Sprint Corporation and Gateway Computers. Dr. Forsythe also previously served as a member of Quality Health Foundation, and Horizons® at the Salisbury School. He is a NACD Board Leadership Fellow and was recognized by Savoy Magazine as one of 2017’s Most Influential Black Corporate Directors. | |||
Director since 2014 Independent Director Age 51 Audit Committee Member and Financial Expert Compensation Committee Member | |||
Key Attributes and Skills: •Extensive experience in leadership, organizational positioning, energy, community engagement, and technology including cyber security •Established relationships with colleagues and members of the community throughout the Delmarva Peninsula •Financial and Audit Committee expertise | |||
 | DIANNA F. MORGAN | ||
| Ms. Morgan retired in 2001 from Walt Disney World Company where she served as Senior Vice President of Public Affairs and Human Resources. She previously oversaw the Disney Institute - a leader in experiential training, leadership development, benchmarking and cultural change for business professionals around the world. Ms. Morgan is a member of the Boards of Marriott Vacations Worldwide Corporation, CNL Healthcare Properties, Inc., and Hersha Hospitality Trust. Ms. Morgan serves as a member of Marriott's Compensation Policy, and Nominating and Corporate Governance Committees. She also serves as Chair of Hersha's Risk Sub-Committee, and as a member of Hersha's Audit, Compensation, and Nominating and Corporate Governance Committees. Ms. Morgan is the past Chair of the Board of Trustees for the University of Florida, Orlando Health, and the National Board for the Children’s Miracle Network, as well as a former member of the Boards of CNL Hotels & Resorts, and CNL Bancshares, Inc. | |||
Director since 2008 Independent Director Age 68 Compensation Committee Chair Corporate Governance Committee Member | |||
Key Attributes and Skills: •Extensive public company, leadership development, and organizational culture experience •Expertise in human capital, public affairs and the customer experience •In-depth knowledge in media relations and government relations | |||
CHESAPEAKE UTILITIES CORPORATION - 2020 Proxy Statement - 8
 | JOHN R. SCHIMKAITIS | ||
Mr. Schimkaitis retired in 2010 as President and Chief Executive Officer of Chesapeake Utilities Corporation. He previously served as Executive Vice President and Chief Operating Officer of the Company and held various other financial and managerial positions throughout his career at Chesapeake Utilities from June 1984 - December 2010. His leadership, business acumen and astute skills successfully led the Company through a period of diversification and growth, including the execution in 2009 of the Company's largest acquisition. Mr. Schimkaitis has served as Chair of the Board of Chesapeake Utilities since 2015 and was Vice Chair of the Board from 2010-2015. | |||
Director since 1996 Independent Director Age 72 Chair of the Board Investment Committee Member | |||
Key Attributes and Skills: •Extensive financial, regulatory and industry experience •Extensive leadership and strategic foresight evidenced by our growth from $95 million market capitalization at the end of 1999 to approximately $395 million at the end of 2010 •In-depth knowledge of the markets in Florida and on the Delmarva Peninsula | |||
| CONTINUING DIRECTORS - CLASS I - TERMS EXPIRE IN 2021 | |||
 | THOMAS P. HILL, JR. | ||
Mr. Hill retired in 2002 from Exelon Corporation where he served as Vice President of Finance and Chief Financial Officer of Exelon Energy Delivery Company. Exelon Corporation is an electric utility that provides energy generation, power marketing and energy delivery. Mr. Hill previously served as Vice President and Controller for PECO Energy, a predecessor company of Exelon Corporation, and held various senior financial, managerial, and other positions during his tenure which began in 1970. Mr. Hill is a Trustee at Magee Rehabilitation Hospital, a member of the Thomas Jefferson University hospital system, and served as Chair of the Audit Committee, and member of the Finance and Investment Committee until August 2018. He is also a Trustee of the Magee Rehabilitation Foundation and Trustee of Abington Memorial Hospital. He served on the Audit Committee for Jefferson Health System, Inc. until its corporate restructuring in 2014. | |||
Director since 2006 Independent Director Age 71 Audit Committee Member and Financial Expert Investment Committee Member | |||
Key Attributes and Skills: •Extensive energy industry experience with energy generation, supply portfolios, marketing and delivery •In-depth knowledge of utility engineering principles and procedures, regulatory environment and utility operations •Financial and Audit Committee expertise | |||
CHESAPEAKE UTILITIES CORPORATION - 2020 Proxy Statement - 9
 | DENNIS S. HUDSON, III | ||
| Mr. Hudson has served as Chairman of the Board of Seacoast Banking Corporation of Florida since 2005 and Chief Executive Officer since 1998, and as Chairman of the Board and Chief Executive Officer of Seacoast National Bank since 1992. He is the former President and Chief Operating Officer of these entities and has held various managerial positions. Mr. Hudson served as a Director and member of the Audit Committee of FPU prior to its acquisition by Chesapeake Utilities. He is an independent Trustee, member of the Audit Committee, and Chair of the Nominating Committee of Penn Capital Funds. He serves on the Boards of the Community Foundation of Palm Beach and Martin Counties, and Visiting Nurses Association of Florida. Mr. Hudson previously served on the Boards of Martin Health System, Helping People Succeed, and the United Way of Martin County, as well as serving as Chair of the Economic Council of Martin County and member of the Miami Board of Directors of the Federal Reserve Bank of Atlanta. | |||
Director since 2009 Independent Director Age 64 Audit Committee Member and Financial Expert Compensation Committee Member | |||
Key Attributes and Skills: •Extensive public company, leadership, and banking experience •In-depth knowledge of the Florida markets •Financial and Audit Committee expertise | |||
 | CALVERT A. MORGAN, JR. | ||
Mr. Morgan is the former special advisor to WSFS Financial Corporation, a multi-billion dollar financial services company. Mr. Morgan served as a member of the WSFS Board and the Audit, Corporate Governance and Nominating, Personnel and Compensation, and Trust Audit Committees until 2019. He also served as a member of the Board and Vice Chair of its principal subsidiary, WSFS Bank. Mr. Morgan is the retired Chair of the Board, President and Chief Executive Officer of PNC Bank, Delaware. He is a member of the Delaware Economic and Financial Advisory Council which provides advice to the Governor and Secretary of Finance on financial and economic conditions involving the State. Mr. Morgan previously served as Chair of the Delaware Business Roundtable, and continues to serve as a Trustee of Christiana Care Corporation. In 2019, Mr. Morgan was inducted into the Delaware Business Leaders Hall of Fame by the Junior Achievement of Delaware Leadership Council. | |||
Director since 2000 Independent Director Age 72 Corporate Governance Committee Chair Compensation Committee Member Investment Committee Member | |||
Key Attributes and Skills: •Approximately 49 years of banking, trust and finance experience and executive leadership expertise •Extensive public company experience •Broad knowledge of the business and economic climate in Delaware | |||
CHESAPEAKE UTILITIES CORPORATION - 2020 Proxy Statement - 10
CONTINUING DIRECTORS - CLASS II - TERMS EXPIRE IN 2022 | |||
 | EUGENE H. BAYARD | ||
Mr. Bayard is Of Counsel with the law firm of Morris James LLP in Georgetown, Delaware. He was a partner with the predecessor law firm of Wilson Halbrook & Bayard where he has served clients since 1974. Mr. Bayard serves in numerous business and community board capacities including: Delaware State Fair, Inc.; Chair of Harrington Raceway & Casino; O.A. Newton & Son Company; J.G. Townsend Jr. and Company; Southern Delaware Advisory Board for WSFS Bank; President of Delaware Wild Lands, Inc.; and Mid-Del Charitable Foundation. Mr. Bayard previously served as a member of the Board of the Delaware Community Foundation. | |||
Director since 2006 Independent Director Age 73 Corporate Governance Committee Member | |||
Key Attributes and Skills: •Extensive expertise in the Delaware legal community, home of the nation’s preeminent forum for Delaware corporations and other business entities •Established relationships with colleagues and members of the community throughout the Delmarva Peninsula •In-depth knowledge of legal, regulatory, and corporate governance practices | |||
 | JEFFRY M. HOUSEHOLDER | ||
Mr. Householder was appointed as President and Chief Executive Officer of Chesapeake Utilities Corporation effective January 1, 2019. He previously served as President of Florida Public Utilities Company from 2010 until December 31, 2018. Mr. Householder has more than 30 years of experience in the energy industry and has served in leadership positions with TECO Energy Peoples Gas, West Florida Gas Company, Florida City Gas, and Tallahassee Utilities. He serves on the Boards of the American Gas Association, the Edison Electric Institute, the Southern Gas Association, and the Florida Natural Gas Association. Mr. Householder is a member of the Delaware Business Roundtable, which focuses on the business and economic climate of Delaware and fostering growth. | |||
Director since 2019 President and CEO, Chesapeake Utilities Corporation Age 62 Investment Committee Chair | |||
Key Attributes and Skills: •Extensive natural gas industry and regulatory experience •Extensive leadership and strategic foresight •Knowledge of the business and economic climate in our service territories, including Florida | |||
CHESAPEAKE UTILITIES CORPORATION - 2020 Proxy Statement - 11
 | PAUL L. MADDOCK, JR. | ||
Mr. Maddock is the Chief Executive Officer and Manager of Palamad, LLC, a real estate holding company located in Palm Beach, Broward, and Dade counties. Mr. Maddock is a member of the Board, Corporate Governance, and Executive Committees of W.C. & A.N. Miller Company, a real estate company in Washington, D.C. He served as a Director and member of the Audit, Compensation and Executive Committees of FPU prior to its acquisition by Chesapeake Utilities. He previously served as Director, Audit Committee Chair, and Executive Committee member of Lydian Bank and Trust, as well as a member of the Boards of PRB Energy, Inc., Wachovia Bank of Florida, 1st United Bank and Trust, and Island National Bank and Trust. Mr. Maddock is the President of THRIFT, Inc., a Palm Beach charitable organization, and is a former Director of the Good Samaritan Hospital. | |||
Director since 2009 Independent Director Age 70 Corporate Governance Committee Member | |||
Key Attributes and Skills: •Extensive public company and utility experience •Expertise in a broad range of real estate matters •In-depth knowledge of the Florida economy | |||
 | |
The Board recommends that stockholders vote FORthe approval of the compensation of the Company's NEOs. We promote a pay-for-performance culture by designing an executive compensation program that includes base salary, as well as short and long-term performance-based incentive awards. Our Compensation Committee | |
 | ||||
 | |
 | |
 | |
 | |
 | |
 | |
 | |
 | |
The advisory resolution, commonly known as a "say-on-pay" proposal, provides you the opportunity to express your views on our executive compensation program for the Company's NEOs. The resolution is responsible for executionrequired by Section 14A of the Company’s strategic plan and providing leadership and oversightExchange Act. We ask you to vote FOR the following resolution: "RESOLVED, that the stockholders of Chesapeake Utilities Corporation approve, on a non-binding, advisory basis, the compensation of the Company’s businesses. Mr. McMasters previously servedNamed Executive Officers as Executive Vice President and Chief Operating Officerdisclosed in this Proxy Statement for the 2020 Annual Meeting of Stockholders."
Voting for the Approval of the Company from 2008 to 2010. Mr. McMasters joined the Company in 1980. During his tenure with the Company, he has also served as Chief Financial Officer, Senior Vice President, Vice President, Treasurer, Director of Accounting and Rates, and Controller. He serves on the Board of DirectorsCompensation of the American Gas Association. Mr. McMasters is also a memberCompany's NEOs. Each share of the Delaware Business Roundtable.
vote. Proposal 2 will be adopteddeemed to be approved, on an advisory basis, if a majority of the Company’sCompany's outstanding common stock present in personat the Meeting or represented by proxy and entitled to vote affirmatively votes in favor of this proposal. Consequently, abstentionsAbstentions will have the same effect of votes castas a vote against this proposal and brokerproposal. Broker non-votes will have no effect on the outcome of this proposal. If this proposal is approved by the stockholders,advisory vote.
CHESAPEAKE UTILITIES CORPORATION - 20172020 Proxy Statement - 912
Compensation Committee Role
General Information. The Compensation Committee is responsible for the oversight and administration of the Company’sCompany's executive compensation program. The Compensation Committee designs, recommends to the Board for adoption, and administers all of the policies and practices related to executive compensation. The Committee, to the extent that it deems appropriate (and, in the case of any of the Company's employee benefit plans, to the extent permitted by the plan), may delegate the day-to-day administration of matters under its authority to employees of the Company, or a subcommittee, subject in all cases to the Committee's oversight.
Independence of Committee Members. On February 24, 2017,26, 2020, the Board determined that none of the Compensation Committee members had any material relationship with the Company in accordance with the NYSE Listing Standards and with the Company's Corporate Governance Guidelines on Director Independence (the "Independence Guidelines"), which are more stringent than the NYSE Listing Standards. Guidelines. Thus, each member of the Compensation Committee is independent, and, other than in their capacity as a director and member of the Compensation Committee and other Committees,Board committees, has no other relationship or arrangement with the Companyus or any of its named executive officers.the NEOs.
Philosophy and Design of Executive Compensation Program. The philosophy of our current executive compensation program is provided in detail in the Compensation Discussion and Analysis section of this Proxy Statement, which begins on page 30.Statement. The section also provides stockholders with comprehensive information on the design of our executive compensation program, as well as the mix of compensation that the Compensation Committee believes aligns the financial interests of the named executive officersNEOs with the interests of our stockholders. During the Compensation Committee’s annual review of executive compensation, it considers several elements of the executive compensation program, including, but not limited to: (i) the effectiveness of the program in attracting and retaining highly qualified individuals that have a solid foundation and comprehensive perspective of the Company, its operations and competitive environment; (ii) the complex nature of our operations as a diversified energy company; and (iii) the long-term focus on our strategic planning process. Additional information on our executive compensation program, including tables and accompanying narratives, is available in the Executive Compensation section of this Proxy Statement, which begins on page 43.Statement. The executive compensation program is centered on the premisecreation of creating stockholder value. This isvalue, evidenced by the payment of consecutive annual dividends to stockholders for 5659 years and the Company’sCompany's earnings performance over many years. The dedication of the Company’sour employees and the commitment and leadership of the Company’s named executive officersour management team have driven the Company’sCompany's growth, in terms of market capitalization, from $95$301 million in 1999at the end of 2009 to approximately $1.1more than $1.5 billion as ofat December 31, 2016. Over one, three, five, ten2019. Chesapeake Utilities’ compound annual total shareholder return has exceeded 14% for the past 3, 5, 10 and twenty20 year periods stockholders have earned more than 13.9% annually on their investment in the Company.ended December 31, 2019.
The Compensation Committee promotes a pay-for-performance culture to further align executive interests with the long-term interests of stockholders. The executive compensation program designed by the Compensation Committee places a majority of the named executive officers’ targetexecutive's total direct compensation at risk. Under the current executive compensation program, each executive officer isofficers are eligible to receive, an equity incentive award based on the achievement of pre-established long-term performance metrics. This equity incentive award comprises the largest performance-based component of each namedour executive officers’ compensation.compensation program. The Compensation Committee works directly with Frederic W.FW Cook, & Co. (“Cook & Co.”), its independent compensation consultant, in designing the executive compensation program. In December 2016,February 2019, FW Cook & Co. provided the Compensation Committee with a market analysis to assess the competitiveness of total compensation for the named executive officers.Company's Executive NEOs for 2019 as further discussed in the Compensation Discussion and Analysis and Executive Compensation sections of this Proxy Statement. The report compared the Company’s payCompany's compensation against market data for the Company’sCompany's peer group, as well as market information from published survey sources. The independent compensation consultant’s report concluded that;that for 2019: (i) named executive officertarget total direct compensation is within afor the Executive NEOs was, in aggregate, below the competitive range of the market median for the Company’sCompany's peer group; and (ii) the executive compensation program promotes a culture of pay-for-performance as a majority of the named executive officers’ compensation is at risk.
| • | The Compensation Committee retains discretion in administering all awards and performance goals, and determining performance achievement; |
| • | Each incentive award features a cap on the maximum amount that can be earned for any performance period; |
| • | Dividends on the equity incentive awards accrue in the form of dividend equivalents during the performance period and are only paid |
| • | Stock ownership requirements are in place for |
| • | |
| • | The |
| • | |
CHESAPEAKE UTILITIES CORPORATION - 20172020 Proxy Statement - 1213
| Proposal | NON-BINDING ADVISORY VOTE TO RATIFY THE APPOINTMENT OF THE INDEPENDENT REGISTERED PUBLIC ACCOUNTING FIRM |
| 3 | The Board recommends a vote FOR the ratification of the appointment of Baker Tilly Virchow Krause, LLP as the Company’s independent registered public accounting firm for 2020. Prior to the reappointment of Baker Tilly, the Audit Committee considered factors such as Baker Tilly's professional qualifications, past performance, quality and level of transparency, expanding utility practice, internal annual evaluations, as well as the length of time the firm has been engaged. |
Appointment of External Audit Firm
The Audit Committee is solely responsible for the appointment, oversight, retention, and termination of the work of the Company’sCompany's independent registered public accounting firm (also referred to in this Proxy Statement as “external audit firm”), including the approval of all engagement fees, terms, and the annual audit plan. On February 23, 2017,25, 2020, the Audit Committee approved the reappointment of Baker Tilly to serve as our external audit firm for 2017.2020. Baker Tilly (independently or through a legacy firm) has served as the Company’s external audit firm since 2007. In determining whether to reappoint Baker Tilly as the Company’s external audit firm, the Audit Committee took into consideration several factors, including an assessment of the professional qualifications and past performance of the Lead Audit Partner and the audit team, the quality and level of transparency of the Audit Committee’s relationship and communications with Baker Tilly, and the length of time the firm has been engaged. The Audit Committee considered, among other things, Baker Tilly’s expanding utility practice and the knowledge and skills of Baker Tilly’s auditing experts that would be providing services to the Company.
Evaluation of External Audit Firm
The Audit Committee previously established criteria and procedures used to evaluate the quality of the audit services. The evaluation focuses on the qualifications and performance of Baker Tilly; the quality and candor of the external audit firm’s communications with the Audit Committee and the Company;Company management; and the external audit firm’s independence and objectivity. In 2016,2019, each member of the Audit Committee, as well as members of management and Internal Audit, completed an evaluation of the quality of the audit services rendered in 2015.2018. The questions were specifically developed for the individualeach respondent given his or her relationship with the external audit firm. The Audit Committee analyzed the results of the assessment, which provided the Audit Committee with additional insight into the effectiveness and objectivity of the Company’sCompany's external audit firm. The Chair of the Audit Committee and the Chief Financial Officer communicated the results of the evaluation process to Baker Tilly’s Lead Audit Partner. The CompanyWe will be undertakingundertake the same process in 20172020 for 2016. 2019's audit services.
The Audit Committee takes additional measures to ensure the audit team is independent and has the experience that createsto facilitate an audit of the highest quality. These measures include, but are not limited to: (i) independently meeting with the external audit firm to discuss communications and other appropriate matters, (ii) pre-approving the audit and non-audit services performed by the external audit firm in order to assure that they do not impair the auditor’s independence, (iii) overseeing the process for the rotation of the Lead Audit Partner to ensure the Lead Audit Partner has the knowledge, experience and quality to sustain the integrity of the Company’s audits and the requisite knowledge inof the Company’s business and expected areas of future growth, and (iv) periodically overseeing the process to solicit proposals from external audit firms to review, among other things, the experience, qualifications, technical abilities, and competitiveness of the audit fees in the industry prior to appointment of the external audit firm.
Non-Binding Advisory Vote to Ratify the External Audit Firm
Although the NYSE listing standards require that the Audit Committee be directly responsible for selecting and retaining the external audit firm, we are providing you with the means to express your view on this matter. While this vote is not binding, in the event that stockholders fail to ratify the appointment of Baker Tilly, the Audit Committee will reconsider this appointment. Even if the appointment is ratified, the Audit Committee, in its discretion may direct the appointment of a different external audit firm at any time during the year if the Audit Committee determines that such a change would be in the best interests of the Company and its stockholders.
Each share of our common stock is entitled to one vote. Proposal 3 will be deemed to be approved, on an advisory basis, if a majority of the Company's outstanding common stock present at the Meeting or represented by proxy and entitled to vote affirmatively votes in favor of this proposal. Abstentions will have the same effect as a vote against this proposal. Brokers will have discretion to vote on this proposal.
A representative from Baker Tilly will be presentavailable at the Annual Meeting and available to respond to appropriate questions. A formal statement will not be made.
CHESAPEAKE UTILITIES CORPORATION - 20172020 Proxy Statement - 1314
3 - AUDIT RELATED MATTERS
Audit Committee Report
To the Stockholders of Chesapeake Utilities Corporation:
The primary functions of the Audit Committee include assisting the Board of Directors in fulfilling its fiduciary responsibilities by providing informed, vigilant, and effective oversight of:
The Company’s accounting policies, procedures and controls;
The performance of the internal audit function;
The appointment, retention, termination, compensation and oversight (including the assessment of the qualifications and independence) of the independent auditors;
The quality and integrity of the Company’s consolidated financial statements and related reports;
The Company's risk management processes; and
The Company’s compliance with legal and regulatory requirements.
This Audit Committee Report is provided by the Audit Committee of the Board of Directors and pertains tobeing submitted in conjunction with the Company’s audited financial statements for the year ended December 31, 2016. Prior2019. In conjunction with our oversight responsibilities, prior to the issuance of the Company’s unaudited quarterly financial statements and annual audited financial statements, wethe Committee reviewed and discussed the earnings press releases, consolidated financial statements and disclosures under “Management’s Discussion and Analysis of Financial Condition and Results of Operations” (including significant accounting policies and judgments) with management, the Company’s management, internal auditors, and the independent external auditors. Weregistered public accounting firm, Baker Tilly Virchow Krause LLP (“Baker Tilly”). The Committee also reviewed the Company’s policies and practices with respect to financial risk assessment, as well as its audit firm,conferred with Baker Tilly Virchow Krause LLP ("Baker Tilly"),on the matters required to be discussed by the applicable audit standards adopted byrequirements of the Public Company Accounting Oversight Board (the "PCAOB"), including and the Auditing Standard No. 1301, Communications with Audit Committees ("AS No. 1301"Securities and Exchange Commission (the "SEC"), which was originally adopted as auditing Standard No. 16, Communications with Audit Committees ("AS No. 16"), but was renumbered effective December 31, 2016..
The Committee discussed with Baker Tilly the overall scope and plan for theirits audit and approved the terms of theirits engagement letter. WeThe Committee also reviewed the Company's internal audit plan. WeThe Committee met with Baker Tilly and with the Company's internal auditor, in each case, with and without other members of management present, to discuss the results of their respective examinations, the evaluation of the Company’s internal controls and the overall quality and integrity of the Company’s financial reporting. The Committee also met regularly with management to discuss accounting, auditing, internal control, financial reporting, earnings and risk management processes and matters. The Committee has received the written disclosures and the letter from Baker Tilly required by applicable requirements of the PCAOB regarding Baker Tilly’s communications with the Committee concerning independence, and has discussed with Baker Tilly its independence. Beginning in 2019, the Committee also engaged in substantive dialogue with Baker Tilly, including training and planning, related to the implementation of the new auditing standard focused on Critical Audit Matters (“CAMs”). The Committee and Baker Tilly engaged in dialogue regarding the audit and expected CAMs to understand the nature of potential CAMs, Baker Tilly’s basis for the determination of the CAM included in their report and how the CAM will be described in their audit report. The discussion of the CAM in Baker Tilly’s report captures and is consistent with our dialogue regarding these matters.
Based on the Committee’s review and the discussions referred to above, the Committee recommended to the Board of Directors that the audited financial statements be included in the Company’s Annual Report on Form 10-K for the year ended December 31, 20162019 for filing with the SecuritiesSEC.
The Audit Committee has appointed Baker Tilly to serve as our independent registered public accounting firm for the fiscal year ending December 31, 2020. In determining whether to appoint Baker Tilly, the Audit Committee took into consideration various factors, including the historical and Exchange Commission (“SEC”).recent performance of Baker Tilly on the audit; the professional qualifications of the firm and the lead audit partner; the quality of ongoing discussions with Baker Tilly; the results of internal surveys of Baker Tilly’s service and quality; the appropriateness of fees; and evidence supporting the firm’s independence, objectivity and professional skepticism. Although the Audit Committee has sole authority to appoint the independent registered public accounting firm, the Committee has recommended that the Board seek stockholder ratification of the appointment at the Annual Meeting as a matter of good governance.
CHESAPEAKE UTILITIES CORPORATION - 2020 Proxy Statement - 15
The information in this Audit Committee Report shall not be considered to be “soliciting material” or be “filed” with the SEC, nor shall this information be incorporated by reference into any previous or future filings under the Securities Act of 1933, as amended, or the Securities Exchange Act of 1934, as amended, except to the extent that the Company incorporated it by specific reference. This reportAudit Committee Report is provided by the following independent directors, who comprise the Audit Committee:
THE AUDIT COMMITTEE
  |   |   |   |
| Thomas J. Bresnan, Chair | Ronald G. Forsythe, Jr. | Thomas P. Hill, Jr. | Dennis S. Hudson, III |
Fees and Services of the Company's Independent Auditors
The following provides information on fees for professional services rendered by Baker Tilly for the two years ended December 31, 20162019 and 2015.2018.
Audit Fees
The aggregate fees that Baker Tilly billed to the Company and its subsidiaries by Baker Tilly in 20162019 and 20152018 totaled $846,249$940,054 and $767,176,$963,551, respectively. Fees for professional services rendered included fees associated with implementation of the new requirement for our external auditors' to communicate critical audit matter(s) in the audit report issued in connection with the audit of our financial statements for 2019; implementation of the new lease accounting standard, ASC 842, Leases; implementation of Accounting Standards Update 2017-12, Derivatives and Hedging (Topic 815): Targeted Improvements to Accounting for Hedging Activities; implementation of the revenue recognition standard, Accounting Standards Codification (ASC) 606, Revenue from Contracts with Customers; matters in conjunctionconnection with the audits of the financial statements included in our Annual ReportReports on Form 10-K; the reviews of the financial statements included in our Quarterly Reports on Form 10-Q; the audits of certain of our subsidiaries or operations typically performed for statutory and regulatory filings or engagements; the audits of internal control over financial reporting as required by Section 404 of the Sarbanes-Oxley Act of 2002, including the testing of Aspire Energy of Ohio's internal controls for the first time in 2016;2002; and the issuance of their consents associated with our registration statements that were filed with the SEC during those two years. In 2016, Baker Tilly also issued a comfort letter in connection with the Company's placement of $57.4 million of new common stock (net proceeds).2018.
Audit-Related Fees, Tax and Other Fees
The aggregate fees billed for audit-related services were $61,146 and $59,262 for 2019 and 2018, respectively. During 20162019 and 2015,2018, Baker Tilly performed annual audits on our benefit plans for the plan years ended December 31, 20152018 and 2014,2017, respectively. The aggregate fees billed for audit-related services were $80,183 and $54,238 for 2016 and 2015, respectively. Fees for professional services rendered in 2016 included services performed in connection with the Company's business development opportunities. The Company did not engage Baker Tilly to provide any tax services or any services other than those described above.
Audit and Non-Audit Services Pre-Approval Policies and Procedures
The Audit Committee pre-approves the audit and non-audit services performed by the Company’sCompany's external audit firm in order to assure that they do not impair the external audit firm’s independence. The Audit Committee may also pre-approve tax services provided by the external audit firm, if any. In November 2016,2019, the Audit Committee reviewed its Audit and Non-Audit Services Pre-Approval Policy and made no changes. Under this policy, the Audit Committee may pre-approve specific services in advance or may pre-approve one or more categories of audit and non-audit services. For all proposed services, the Audit Committee will, among other things, consider whether the external audit firm is the best positioned to provide the proposed services most effectively and efficiently based on its familiarity with the Company’sour business, people, culture, accounting systems, risk profile and other factors, and whether the services are likely to enhance the Company’sour ability to manage or control risk or improve audit quality. The Audit Committee may establish ceilings on the level of fees and costs of generally pre-approved services that may be performed.
The Audit Committee has delegated to the Chair of the Audit Committee (and(who may delegate authority to any other member of the Audit Committee) authority to pre-approve up to $40,000 in audit and non-audit services, which authority may be exercised when the Audit Committee is not in session. At least annually, the external audit firm is required to report to the Audit Committee on the specific services provided and the amounts that have been paid to the external audit firm. The Chief Financial Officer is required to report to the Audit Committee on the specific services provided and the amounts paid by the Company. The Company's Internal Audit departmentteam is responsible for monitoring and reporting on the performance of all services provided by the external audit firm and to determine whether these services are in compliance with the Audit Committee’s policy. In 20162019 and 2015,2018, the Audit Committee approved 100 percent100% of all audit and non-audit services provided to the Company by Baker Tilly.
CHESAPEAKE UTILITIES CORPORATION - 20172020 Proxy Statement 15
4 - BOARD OF DIRECTORS AND ITS COMMITTEES
Board Leadershipof Directors
Board Oversight. The Board is elected by the Company’sCompany's stockholders to oversee the direction and strategy of the business that is being carried out by management and to ensure that itthe Company continues to operate in the best interests of all stakeholders. On behalf of our stockholders, the Board and its Committees monitor corporate performance, the integrity of financial controls, and the effectiveness of our compliance and risk management programs, including cyber security. The Board works diligentlyalso oversees plans for the succession of key executives and is integrally involved in the strategic planning and capital budget processes, as well as establishing key financial and operational metrics. This year-round oversight process is facilitated through the diversity of our Board who has a broad range of personal and professional skills, experience and expertise in leadership, corporate governance, board service, energy, economics, finance, public affairs, academia, and entrepreneurism. The Board is also comprised of a majority of directors who have served as chief executive officers at other organizations and bring skillful business acumen to fulfillthe boardroom. Collectively, the incumbent Board has a vast amount of diverse experience and established personal and professional relationships in the communities we serve.
Board Culture. The Board has a strong boardroom culture that enables directors to express their opinions openly in the boardroom and engage in candid dialogue. Directors are strongly encouraged to attend the Board and Committee meetings, as well as the Annual Meeting of Stockholders. In 2019, nine of our eleven directors serving from our May 2018 to May 2019 Annual Meeting were in attendance at the 2019 Annual Meeting of Stockholders. Each director actively participated in 75% or more of Board and their respective Committee meetings held in 2019. The Board held six meetings during 2019. Board and Committee meetings were held in or around select service territories enabling the Board to remain connected with employees, customers, stockholders, and the communities we serve. Each independent director has access to our Chief Executive Officer and other members of the management team and may request agenda topics to be discussed in more detail at meetings of the full Board or one of its fiduciary dutiesCommittees. Directors may not serve on more than two other public company boards in accordance with our Corporate Governance Guidelines.
Business Performance. 2019 was a remarkable year as measured by any number of metrics. The leadership of the Board and the collective efforts of the Chesapeake Utilities team contributed to protectstrong financial results in 2019, including those metrics tied to performance-based compensation.
The Company's net income for the year ended December 31, 2019 was $65.2 million, or $3.97 earnings per share (basic), generating record performance for the Company. The growth and initiatives pursued by our businesses in 2019 generated increased EPS of $0.51 per share (2019 EPS of $3.97 per share versus $3.46 per share in 2018). Higher earnings for 2019 reflect increased gross margin from recently completed and ongoing pipeline expansion projects, incremental margin from the acquisition of certain assets of Marlin Gas Transport, R.F. Ohl Fuel Oil, Inc. and Boulden Inc., organic growth in the natural gas distribution operations, and higher retail propane margins. A Florida Public Service Commission regulatory order that enabled the Company to retain tax savings associated with lower federal tax rates resulting from the United States Tax Cuts and Jobs Act in several natural gas distribution operations and continued growth in gross margin from Aspire Energy also contributed to higher earnings growth in 2019. Finally, the sale of the assets of our natural gas marketing operation, net of their operating results pre-sale, contributed $0.24 per share. The strong gross margin growth and proceeds from the sale of this business more than offset $4.9 million in lower gross margin due to a decline in customer consumption as a result of warmer weather in 2019 compared to 2018. Excluding the impact of the sale of the natural gas marketing assets, the Company's results also represent record performance. 2019 EPS from continuing operations (which excludes discontinued operations of this business and the sale of its assets) was also a record $3.73 per share, an increase of $0.25 per share or 7.2% over 2018's EPS from continuing operations of $3.48 per share. Our strong financial results translated into a 12% ROE, or 11.3% in terms of continuing operations ROE. Over the past five years, we have generated an annual ROE ranging from 11.0% to 13.0%, which represents top quartile performance over the long-term when compared to our performance peer group. Our ROE has been driven by our innovative approach to cultivate, develop and consummate growth projects and initiatives and generating higher returns from our unregulated energy businesses. We have paid dividends to our stockholders without interruption for 59 years. The Board increased the annualized dividend in 2019 by 9.5% over the prior year reflecting our commitment to stockholder value through dividend growth that is cultivated from sustainable earnings growth. The efforts of the Chesapeake Utilities team throughout 2019 have positioned us for continued future growth in 2020 and beyond.
Director Nominations. Throughout the year, the Corporate Governance Committee evaluates board composition and board succession, including practices benchmarked against our peer companies, the S&P 500 and the top 100 U.S. public companies. The Committee considers a range of practices, including board size, average age of directors, tenure, retirement policies, diversity, in addition to other topics such as corporate culture, workplace ethics, and environmental, social and governance practices. The Committee discusses the Board’s current profile in the context of the Board as a whole over the near and long-term, director skills and attributes, as well as established guidelines which collectively help to inform our strategic plan. The Committee also considers feedback received during the Board evaluation process. The process may lead to the vetting of potential board candidates who we receive through contacts in the business, civic and legal communities and a variety of other sources or by third-party business partners. Prior to nominating a candidate, the Committee considers a multitude of factors, including biographical and other background information, criteria adopted by the
CHESAPEAKE UTILITIES CORPORATION - 2020 Proxy Statement - 17
Committee, the Company's governing documents, experience and relationships in the energy industry and the communities we serve, community involvement, a candidate’s availability and commitment level, and whether a candidate is independent under applicable rules and listing standards. The Committee also considers the Director Eligibility Guidelines, which include integrity, ethics, diversity, and the ability for a candidate to listen and work in a collegial manner. In addition, for new candidates, the Committee considers the results of the candidate’s interview, which is conducted by the Chair of the Board, Corporate Governance Committee Chair, and the Chief Executive Officer, where topics such as depth of experience, business acumen, technical expertise, commitments and cultural fit are discussed. Following this process, and if appropriate, the Committee nominates and recommends to the Board that it formally nominate the candidate to serve as a director. At each annual meeting, our stockholders vote to elect all director nominees for the applicable class. In the case of a director nominee appointed to fill a vacancy, the nominee will stand for election at our next annual meeting of stockholders, regardless of class. Once elected, a new director participates in our director orientation program held at one of our facilities. The program familiarizes the director with various aspects of the Company, including our strategy, business structure, financial performance and competitive landscape.
Stockholders may also nominate candidates for consideration by the Committee if they satisfy all of the requirements in our Bylaws, Corporate Governance Committee Charter, and Director Eligibility Guidelines. Stockholder submissions to nominate a candidate for election as a director must be sent in writing to our Corporate Secretary and received at the Company’s assetsprincipal office not less than 90 days nor more than 120 days prior to the annual meeting at which the director is to be elected.
Director Eligibility Guidelines. To evaluate potential director nominations, the Board adopted Director Eligibility Guidelines. These guidelines include the following:
Be a leader in a field of expertise or demonstrate professional achievement through a position of significant responsibility
Promote and stockholders’ investment. reflect a diversity of experiences and perspectives to evaluate and understand an ever evolving business landscape
Exercise sound business judgment
Possess integrity and high ethics
Listen and work in a collegial manner
Have a reputation that is consistent with our image and reputation
Be absent of any conflict of interest that would impair the ability to represent the interest of our stockholders
Be diverse in skills, knowledge and experience that enhances the Board's core competencies, enables differing points of view, and further maximizes stockholder value
Board Leadership
The Board is led by the Chair, who is elected annually by the Board. At its meeting onOn May 4, 2016,8, 2019, the Board elected John R. Schimkaitis to serve as the non-executive, independent Chair. Mr. Schimkaitis has served as Chair since 2015 and previously served as the Vice Chair of the Board from 2010 to 2015. Mr. Schimkaitis has performed the responsibilities prescribed to him by the Board and those detailed in the Corporate Governance Guidelines, including establishing the agenda for and leading Board meetings, and facilitating communications among Board members and communications between the Board and the Chief Executive Officer outside of Board meetings. Mr. Schimkaitis has more than 40 years of experience in the utility industry, including 25 years in key management roles within the Company. This utility experience, his knowledge of the Company and its businesses, his understanding of the Delmarva Peninsula and Florida markets, as well as his leadership skills are advantageous in leading the Board in the performance of its duties. Based on Mr. Schimkaitis’ qualifications and experience, the Board believes that the current Board leadership structure is the most appropriate structure for the Company and its stockholders at this time.
Director Independence
The independent directors bring expertise, objectivity and diverse perspectives to the Board. The NYSE Listing Standards governing independence require that a majority of the members of the Board be independent. Our Corporate Governance Committee regularly engagesGuidelines are available on our website at www.chpk.com/Our Company/Corporate Governance/Corporate Governance Guidelines. In accordance with our Corporate Governance Guidelines, on February 26, 2020, the Board conducted its annual review of director independence. During this review, the Board examined all direct and indirect transactions or relationships between the Company or any of its subsidiaries and each director and any immediate family member of the director and determined that no material relationships with the Company existed during 2019, except as provided below.
On the basis of this review, the Board determined that ten of the eleven directors (or 91%) serving as of February 26, 2020, are independent. Each of the following directors qualifies as an independent director as defined by the NYSE Listing Standards and in discussion on Board compositionaccordance with the Company's Corporate Governance Guidelines: Eugene H. Bayard, Thomas J. Bresnan, Ronald G. Forsythe, Jr., Thomas P. Hill, Jr., Dennis S. Hudson, III, Lila A. Jaber, Paul L. Maddock, Jr., Calvert A. Morgan, Jr., Dianna F. Morgan and succession planning as further discussed on page 22. The Board may, at a future date, combine the ChairJohn R. Schimkaitis. Mr. Householder, our President and Chief Executive Officer, roles if the Board determines that suchis a leadership structure would be appropriate.
CHESAPEAKE UTILITIES CORPORATION - 20172020 Proxy Statement 17
Audit Committee
 | In 2019, the Committee continued to oversee the review of our financial reports filed with the SEC, risk management program, cyber security efforts, implementation of several significant accounting standards, internal controls, and compliance initiatives. The Committee focused on policies and procedures, as well as ensuring the appropriate risk infrastructure is in place that will support operations as we continue to grow. | ||||
| Thomas J. Bresnan, Chair | Ronald G. Forsythe, Jr. | Thomas P. Hill, Jr. | Dennis S. Hudson, III | ||
| |||||
4 - Financial Experts 5 - Meetings held in 2019 | |||||
Experience and Service: Messrs. Bresnan, Forsythe, Hill and Hudson each qualify as an “audit committee financial expert” (as defined by the SEC) based on his experience and knowledge in accordance with the SEC rules.knowledge. Biographical information on each Committee member can be reviewed beginning on page 4is provided in Proposal 1 of this Proxy Statement. EachIn 2019, each Committee member participated in an annual training session given by Baker Tilly and otherconversed with internal and third partythird-party experts on risk management, accounting trends, changes to the accounting standards, and theirany potential impactimplications on the Company. None of the Committee members of the Audit Committee currently serve on an audit committee of another public company.
Reviewed and discussed with management complex accounting judgments and estimates for several transactions, including acquisition accounting, divestiture transactions, and de-risking of the Chesapeake Utilities Corporation Pension Plan
Corporate Governance Committee
 | In 2019, the Company's Corporate Governance team was named Governance Team of the Year (small to mid-cap sized companies) by the Corporate Secretary magazine. We continue to focus on Board Succession and promoting the diversity of experiences and perspectives on the Board. In addition, we continue to collectively enhance our established culture of sustainability and corporate governance, and commit to the highest ethical standards in conducting business every day. | |||||
| Calvert A. Morgan, Jr., Chair | Eugene H. Bayard | Paul L. Maddock, Jr. | Dianna F. Morgan | |||
CHESAPEAKE UTILITIES CORPORATION - 20172020 Proxy Statement - 19
6 - Meetings held in 2019 | |||||||||
Benchmarked board composition and profile practices across our peer companies, the energy industry, and broader indices such as the S&P 500 and Top 100 U.S. public companies
Compensation Committee
 | In 2019, the Committee oversaw the Company's ongoing management succession planning and reviewed the executive compensation structure and practices to ensure alignment with the Company's strategic initiatives and performance goals. The Company's success is the direct result of its strong culture that fully engages employees and promotes the inclusion of every team member. | ||||
| Dianna F. Morgan, Chair | Ronald G. Forsythe, Jr. | Dennis S. Hudson | Calvert A. Morgan, Jr. | ||
 | |||||
for additional information on the Committee's responsibilities. | |||||
Independent Advisor: The Compensation Committee is directly responsible for the appointment, compensation and oversight of the work of any consultant or other advisor it retains. The Committee may, in its sole discretion, engage a consultant or other advisor to assist in the evaluation of executive and director compensation. The Committee retained Frederic W.reviewed the independence of FW Cook & Co. (“Cook & Co.”)and, on May 7, 2019, engaged them for services to be performed in 2016. The Compensation Committee reviewed the independence of Cook & Co.ensuing year. After considering various factors, including the specific factors described in the SEC rules and those provided under the NYSE’s Listing Standards, the Compensation Committee determined that FW Cook & Co. is independent andwith no conflicts of interest exist with respect to Cook & Co.interest.
Considered a market analysis prepared by FW Cook & Co. that compared the Company’sCompany's executive compensation againstpractices with market data for the Company’sCompany's peer group, as well as fromwith industry published survey data
CHESAPEAKE UTILITIES CORPORATION - 2020 Proxy Statement - 20
Investment Committee
Board and Committee Evaluations
Annually, the Corporate Governance Committee reviews and establishes the criteria that is used by the Board, and the Audit, Compensation and Corporate Governance Committees, for conducting evaluations for performance during the preceding year. The annual evaluation provides for continuous process improvements in Board and Committee functioning and communication, and is a medium for Board refreshment. The Board and its Committees conduct evaluations to assess the qualifications, attributes, skills and experience represented on the Board and its Committees, to consider whether appropriate resources are available to the Board and its Committees, and to assess whether the Board and its Committees are functioning effectively. An annual review of the evaluation methodology is performed to ensure the evaluations are aligned with our culture and growth, as well as with best practices. Periodically, the Chair of the Board and the Chair of the Corporate Governance Committee will conduct one-on-one discussions with each director. In determining the evaluation process for 2020, which reviewed Board and Committee performance in 2019, the Corporate Governance Committee considered best practices relating to annual evaluations for Boards and Committees. After discussion and consideration, the Committee enhanced the evaluations to provide additional clarity to align the evaluations with our current practices. The Chair of the Corporate Governance Committee receives a report of the results of the Board and Corporate Governance Committee Evaluations. The Chairs of the Audit Committee and Compensation Committee receive a report of the results of their respective Committee Evaluations. The Committee Evaluation results are discussed at Committee meetings and reported to the Board at the next Board meeting. The Chair of the Corporate Governance Committee reports the results of the Board Evaluation at the next Board meeting.
Risk Oversight
Board of Directors
The Board is responsible for oversight of the Company's risk management activities, working closely with its standing Committees and the management team. Each standing Committee reports its discussions to the Board for consideration. As part of our enterprise risk management program, short and long-term risks are identified through top-down and bottom-up approaches and strategic plan assessments that depict potential market, operational, strategic, legal, regulatory, political, environmental, social, safety, compliance, and financial risks that could affect our operations, financial performance and/or strategic plan. In addition, the Board considers material risks that may cause a disruption to our business due to natural disasters, public health crises, and other circumstances severely interrupting business operations. The Board continuously reviews and monitors risk and receives a Risk Scorecard that updates the Board on the Company's risk profile. The “Risk Factors” section of our 2019 Annual Report on Form 10-K provides additional information on our potential risks. After assessing our risks, internal processes, practices and controls are established to continually monitor and mitigate risk. We recognize that it is neither possible nor prudent to eliminate all risk. In fact, purposeful and appropriate risk taking is essential for execution of our strategic plan, for our overall continued growth, and for execution of initiatives that have the potential to generate value to our stockholders.
Standing Committees
The Audit Committee assists the Board in fulfilling its oversight of our risk exposure and implementation and effectiveness of our risk management programs, including enterprise risk management. The Committee approves our Global Risk Management Policy, which serves as our risk management framework. Specific items such as financial, internal controls, regulatory, credit and counterparty, market, liquidity, cyber, insurance, strategic, and business risks are reviewed and considered by the Committee, as well as our insurance program and coverages that are in place to mitigate these and other risks. The Investment Committee assists the Board in fulfilling its oversight of risks related to evaluating new investments and ensuring they achieve our financial targets. The Committee considers the financial and operational risks of entering into new, or expanding in existing, service territories and businesses. The Compensation Committee assists the Board in fulfilling its oversight of risks that may arise in connection with our compensation programs and practices. The
CHESAPEAKE UTILITIES CORPORATION - 20172020 Proxy Statement - 21
Committee considers the appropriateness of our compensation programs and practices and whether they incentivize short and long-term financial and operational performance without encouraging unnecessary risk. Specific items such as organizational development, executive retention and succession planning are reviewed and considered by the Committee. The Corporate Governance Committee regularly engages assists the Board in discussion onfulfilling its oversight of risks that may arise in connection with our governance structure and practices. The Committee reviews our governance structure and practices no less than annually and considers whether our ethical and operational framework is resilient and responsive to our employees and stockholders. Specific items such as sustainability, Board succession planning, Board structure and composition, stockholder communications, director independence, and succession planning. related governance practices are reviewed and considered by the Committee.
Team Commitment to Risk Management
The Corporate Governance Committee identifies potential director nominees through contactscommitment of our team across the organization contributes to the precision of our risk profile, the integrity of our controls, our ability to continuously monitor risk, and the depth of information provided to the Board to effectively consider and evaluate companywide risks. This top-down and bottom-up approach is reflected throughout our disciplined approach to matters and our decision-making process. The management team is intimately involved in the business, civicdevelopment and legal communitiesdeployment of our risk management practices and regularly collaborates with the Board and its standing Committees on our risk posture, including financial and investment activities, strategic plan initiatives, and macroeconomic contributors. The management team, representatives from our businesses, and cross-functional team members also routinely participate in internal committees and focus groups, such as cyber security, identity theft, sustainability, and risk management. Independent consultants and third-parties periodically attend these meetings to provide independent insight and education on various risk-related topics. Throughout the organization, our team also annually meets and collaborates with Internal Audit on identifying new or evolving risks that could have a variety of other sources. The Committee may retain a search firm or utilize third-party database search toolspotential impact on the Company. In addition, our team actively works across the enterprise to identify, director nominees. Stockholdersmitigate and respond to material risks that may nominate candidates for election as directors by submittingcause a written submissiondisruption to our business due to natural disasters, public health crises, and other circumstances severely interrupting business operations. Our team participates in industry events and speaks on risk-related matters alongside practice leaders. Information obtained from these additional avenues continues to strengthen our risk profile, controls, policies and practices, and allow us to better provide informed recommendations to the Corporate Secretary atAudit Committee for consideration.
Cyber Security and Physical Infrastructure
The Board and management team recognize the Company’s principal offices not less than 90 days nor more than 120 days priorimportance of maintaining the trust and confidence of our employees, customers, and other stakeholders. We devote significant time and energy to the annual meeting at which directors areoversight of cyber security and to be elected. The written submission must comply withmaintaining the provisions of the Company’s Bylaws and the Corporate Governance Committee’s Charter. The Corporate Governance Committee will consider all candidates recommended by stockholders who comply with these provisions and satisfy the Director Eligibility Guidelines.
| We have several security teams comprised of diverse representation across the enterprise with varying expertise | We receive presentations from external parties on topics related to cyber and physical security | |
| The Board and Audit Committee receive periodic updates from the Chief Information Officer, Internal Audit team, and other members of our management team | The Audit Committee oversees our cyber and physical risks and reviews the appropriateness of our insurance coverage after considering the expertise and advice of our insurance broker | Certain Board members have technology experience, including previous service as Chief Information Officer and as Chief Executive Officer of a technology service provider |
| We have an established companywide cyber security education and training program | We have multiple layers of controls, which include comprehensive due diligence and oversight of third-party relationships | |
| We have established relationships with our service providers | We have engaged independent third-parties to assist in enhancing our security posture | We continue to make investments in our technology and physical infrastructure |
| We are members of trade organizations that | ||
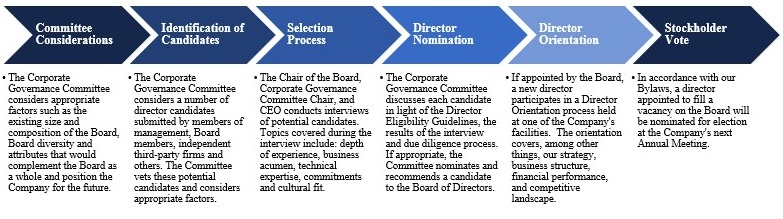
CHESAPEAKE UTILITIES CORPORATION - 20172020 Proxy Statement - 22
5 - CORPORATE GOVERNANCE AND STOCK OWNERSHIP
Governance Trends and Director Education
General Information. The Board and its Committees proactively monitor legislative and regulatory initiatives, market trends, as well asand other corporate governance trendsinitiatives. Members remain informed through a variety of resources, including internal and their potential impact on the Company. Each director has access toexternal publications, and other resources that cover these matters. In 2016, the Board received a presentation from an industry expert on the potential impact of the presidential election on energy policy. In 2014 and 2015, the Board received presentations from two of our long-term institutional investors, which provided additional information on portfolio management roles and processes associated with their investment decisions, as well as the firms’ views on the Company’s performance, industry dynamics, and valuation. In previous years, professionals in the financial community presented on various aspects of the utility industry, including the then current macro economic outlook, market trends, utility industry fundamentals, downstream utility focus, current valuations, investor perception, industry framework, and current industry topics. Experts in the areas of corporate governance, proxy advisory services and investor relations have also spoken to the Board on regulatory actions, governance trends and various other corporate governance topics. The Board has also received corporate governance updates from a Chancellor from the Delaware Court of Chancery, a Chief Justice of the Delaware Supreme Court, and established members of the academic, governance, investor relations, legal and financial communities who are experienced in the utilities industry and the broader market. Directors participated in continuing education sessions, to remain informed on recent trends applicable to their Committee duties. Certain directors also participate in continuing legal education. Newlyeducation, and external programs. The Board and its Committees also engage with external parties on a broad range of topics some of which are provided below.
• | Industry experts on energy policy, energy trends, market factors and competition, growth opportunities, key customer growth expectations, and future outlook of the natural gas industry |
| • | Industry experts on corporate governance, proxy advisory services and investor relations |
| • | Institutional investors on portfolio management and the firms’ views on our performance, industry dynamics, and valuation |
| • | Financial community on the utility industry, including macro-economic outlook, market trends and valuations, industry fundamentals, investor perception, and industry framework |
| • | Members of the legal community on corporate governance topics, including a former Chancellor of the Delaware Court of Chancery, and a former Chief Justice of the Delaware Supreme Court |
| • | Established members of academia experienced in the utilities industry and broader market |
In addition, newly elected directors participate in a comprehensive director orientation program that covers, among other things, ourcovering various topics including strategy, business structure, financial performance, and competitive landscape. As part of this program, directors are invited to participate in a tour of selected facilities of the Company. Several of our Board meetings are held in various locations throughout ouror around select service territories. This providesterritories which give the directors thean opportunity to become more familiar withsee our operations andfirst-hand, to visit the communities we serve. During these visits, the Board also has the opportunityserve, and to engage with our employees in the applicable service areas. Industry experts have also spoken to the Board on such topics as energy trends, market factors and competition, growth opportunities, key customer growth expectations, and future outlook.
Corporate Governance Practices
Governance Transparency and Accountability.The Board and Corporate Governance Committee annually review our corporate governance documents and practices to ensure that they provide the appropriate framework under which the Company operates.we operate. Our corporate governance documents can be viewed on our website at www.chpk.com/our-company/corporate-governance. These documents include the Charters for each standing Board Committee – Audit Committee, Compensation Committee, Corporate Governance Committee and Investment Committee; Corporate Governance Guidelines; Business Code of Ethics and Conduct (“Code of Ethics”); Code of Ethics for Financial Officers; Corporate Governance Guidelines on Director Independence; and Communications with the Board. Additional information in the Corporate Governance section of our website includes the composition of our Board and Committees and a summary of our Ethics and Compliance Program. Under the Investors section of our website, www.investor.chpk.comwww.chpk.com/investors, we provide links to our filings with the SEC, including our Annual Report on Form 10-K, and quarterly reportsQuarterly Reports on Form 10-Q, and equity ownership reports for our executive officers. Under the News section of our website, www.chpk.com/news, we provide press releases on financial, corporate and community activities. In this sectionThe Company's Annual Report can be viewed on our website you can also read more about the Company's Combined Heatat www.chpk.com and Power Plant being named "Best CHP Project of the Year",provides additional information on our Delmarva propane operations being named the "Best Gas Company" on the Delmarva Peninsula, two ofenergy delivery services and our subsidiaries (Eastern Shore Natural Gasenvironmental stewardship and Florida Public Utilities Company) receiving national safety awards, an announcement of the Company's largest natural gas pipeline expansion (Eastern Shore Natural Gas - 2017 System Expansion Project), recognition the Company received for its involvement in the community, as well as information about the Company being named a Top Workplace in Delaware (for the fifth consecutive year).social practices.
Corporate Governance Guidelines.The Board has adopted Corporate Governance Guidelines which consist of a series of policies and principles that are adhered to when overseeingprovide a framework for the corporate governance of the Company. The Corporate Governance Guidelines focus on Board composition and director qualifications, Board refreshment, Board independence, Board meetings, Board committees, Board access to management and advisors, Boardthe Board's relationship to senior management, director compensation, and the annual review of Board and Committee effectiveness.
Code of Ethics. The Board has adopted a Code of Ethics that reflects our commitment to continuously promote professional conduct throughout the organization, and to ensure that Company representatives of the Company demonstrate good ethical business practices. In 2019, the Board, upon recommendation of the Corporate Governance Committee, amended the Code of Ethics to enhance the language around the Company’s culture and practices with regards to maintaining confidential information, as well as to add language regarding non-disparagement. In addition, in early 2020, a video was sent to directors and employees throughout the Company which highlights our commitment to the highest ethical standards and the importance of engaging in sustainable practices when directors and employees are conducting business on behalf of the Company. Directors are required to disclose any conflict of interest to the Company’sCompany's non-management, independent
CHESAPEAKE UTILITIES CORPORATION - 2020 Proxy Statement - 23
Chair of the Board and to refrain from voting on any matter(s) in which they have a conflict. In considering whether an actual conflict of interest exists, factors to be considered include, but are not limited to, the benefit to the Company and the aggregate value of the transaction.
Directors and certain employees annually confirm compliance with the Code of Ethics.
The Board has also adopted a Code of Ethics for Financial Officers that provides a framework for honest and ethical conduct by our financial officers as they perform their financial management responsibilities. The Code of Ethics for Financial Officers is applicable to the Chief Executive Officer, President, Chief Financial Officer, Chief Accounting Officer, Treasurer, Corporate Controller, and others who are responsible for ensuring accurate and timely disclosures of financial information within our filings with the SEC. Other senior managers with accounting and financial reporting oversight must annually confirm compliance with the Code of Ethics for Financial Officers.
Related Persons Transactions. We review relationships and transactions in which the Company, or any of its subsidiaries, and our executive officers, directors, director nominees, 5% or greater stockholders or their immediate family members are or will be participants, to determine whether such related persons have a direct or indirect material interest.interest in any such transaction. A related person transaction wouldcould include, but is not limited to, any financial transaction, arrangementtransactions, arrangements or relationship, anyrelationships, including indebtedness or guaranteeguarantees of indebtedness, and any series of similar transactions, arrangements or relationships. In determining whether to approve or ratify a related person transaction, the disinterested members of the Audit Committee, as part of an annual review or as required, will consider the relationship of the individual to the Company, the materiality of the transaction to the Company and the individual, and the business purpose and reasonableness of the transaction. The Audit Committee may approve or disapprove the transaction and direct the officers of the Company to take appropriate action. The Audit Committee may also refer the matter to the full Board with a recommendation. If it is determinedthe Audit Committee or the Board determines that a related person had or will have a direct or indirect material interest in a Company transaction is directly or indirectly material tocurrently proposed transaction meeting the Company or a related person,threshold set forth in Item 404(a) of Regulation S-K, the transaction will be disclosed in the Company’sour proxy statement.
The Company’s Code of Ethics requires that individuals provide prompt and full disclosure of all potential conflicts of interest (including related person transactions) to the appropriate person. These conflicts of interest may be specific to the individual or may extend to his or her family members. Any officer who has a conflict of interest with respect to any matter is required to disclose the matter to the Chief Executive Officer, or if the Chief Executive Officer has a conflict of interest, the Chief Executive Officer would disclose the matter to the Audit Committee. All other employees are required to disclose any conflict of interest to Internal Audit. Directors are required to disclose any conflict of interest to the Chair of the Board and to refrain from voting on any matter(s) in which they have a conflict. In addition, directors, executive officers and designated employees must disclose to the Company, in an annual ethics questionnaire, any current or proposed conflict of interest (including related person transactions).
All employees and executive officers are encouraged to avoid relationships that have the potential for creating an actual conflict of interest or a perception of a conflict of interest. The Company’s Code of Ethics provides specific examples that could represent a conflict of interest, including, but not limited to, the receipt of any payment, services, loan, guarantee or any other personal benefits from a third partythird-party in anticipation of or as a result of any transaction or business relationship between the Company and the third party.third-party. No employee or executive officer is permitted to participate in any matter in which he or she has a conflict of interest unless authorized by an appropriate Company official and under circumstances that are designed to protect the interests of the Company and its stockholders and to avoid any appearance of impropriety.
For the period beginning January 1, 20162019 and ending March 10, 2017,2020, there were no transactions, or currently proposed transactions, in which the Company was or is to be a participant and the amount involved exceeds $120,000, and in which any related person had or will have a direct or indirect material interest.
Anti-Hedging Policy and PledgesPledging of Securities.Directors, executive officers and employees of the Company may not engage in hedging transactions related to the Company's stock or pledge the Company's stock as collateral for a loan. The Chief Financial Officersecurities. Directors, executive officers, and employees and their "related persons" (as defined in our Securities Trades by Company Personnel and Related Persons Policy) may grant an exception to an individual who desires tonot pledge the Company's stock as collateral for a loan (excludingor hold the Company's stock in a margin debt) if such individual clearly demonstrates the financial capacity to repay the loan without resort to the pledged securities. No exception was granted in 2016 or as of the date of this Proxy Statement.account.
Executive Sessions. The Chair of the Board presides over executive sessions of the non-management directors. The Company’sCompany's Corporate Governance Guidelines ensure the integrity of these meetings by providing that the Chair of the Corporate Governance Committee would preside over these meetings in the event that the Chair of the Board wasis a management director. The Corporate Governance Guidelines also provide that if the non-management directors includedinclude any director who did not qualify as independent under the NYSE Listing Standards, the independent directors would meet at least annually without the non-independent director(s).
CHESAPEAKE UTILITIES CORPORATION - 20172020 Proxy Statement - 24
Security Ownership of Certain Beneficial Owners and Committee Self-EvaluationsManagement
| SECURITY OWNERSHIP OF CERTAIN BENEFICAL OWNERS AND MANAGEMENT | ||
| Name of Beneficial Owner | Total Shares Owned Beneficially(1) | % of Class (* Less than 1%) |
| Eugene H. Bayard | 32,660 | * |
| Thomas J. Bresnan | 22,525 | * |
| Beth W. Cooper | 79,758 | * |
| Ronald G. Forsythe, Jr. | 5,369 | * |
| Thomas P. Hill, Jr. | 32,748 | * |
| Jeffry M. Householder | 18,791 | * |
| Dennis S. Hudson, III | 13,598 | * |
| Lila A. Jaber | 254 | * |
| Paul L. Maddock, Jr. | 49,256 | * |
| Calvert A. Morgan, Jr. | 45,732 | * |
| Dianna F. Morgan | 15,035 | * |
| James F. Moriarty | 9,666 | * |
John R. Schimkaitis(2) | 116,616 | * |
| Stephen C. Thompson | 72,893 | * |
| Kevin J. Webber | 209 | * |
| Executive Officers and Directors as a Group | 515,110 | 3.14% |
| Name of Investment Advisor | ||
T. Rowe Price Associates, Inc.(3) 100 E. Pratt Street Baltimore, MD 21202 | 2,310,075 | 14.07% |
BlackRock, Inc.(4) 55 East 52nd Street New York, NY 10055 | 1,200,765 | 7.31% |
The Vanguard Group(5) 100 Vanguard Blvd. Malvern, PA 19355 | 1,074,976 | 6.55% |
1 | Unless otherwise indicated in a footnote, each beneficial owner possesses sole voting and sole investment power with respect to his or her shares shown in the table.Voting rights are shared with spouses and other trustees in certain accounts for Thomas J. Bresnan (10,741 shares), Beth W. Cooper (2,131 shares), Jeffry M. Householder (408 shares), Paul L. Maddock, Jr. (18,000 shares), Calvert A. Morgan, Jr. (21,207 shares) and John R. Schimkaitis (92,894 shares). An independent account is held by the spouse of Thomas P. Hill, Jr. (14,937 shares). |
2 | Mr. Schimkaitis held the position of Chief Executive Officer of the Company from January 1999 until his retirement in December 2010. Mr. Schimkaitis received a reduced early retirement payment under the Pension Plan. Mr. Schimkaitis received his distribution in the form of a lump sum after providing property equal to 125% of the restricted portion of the lump sum in accordance with the Internal Revenue Code’s tax requirements. Currently, Mr. Schimkaitis has deposited 7,000 shares in escrow to satisfy the requirement. This property was placed in escrow, with oversight by a third party escrow agent. Until the Pension Plan is fully funded, as defined under the Internal Revenue Code, each year, shares equal to the value of payments that would have been paid to Mr. Schimkaitis if he had elected the life annuity form of distribution will become unrestricted and returned to Mr. Schimkaitis, subject to the remaining property retaining a minimum market value. |
3 | According to their report on Schedule 13G/A, filed on February 14, 2020, T. Rowe Price Associates, Inc. (“T. Rowe Price”) was deemed to beneficially own 2,310,075 shares or 14.0%, of our common stock as of December 31, 2019. According to the Schedule 13G/A, T. Rowe Price had sole power to vote 608,182 shares and to dispose of 2,310,075 shares. T. Rowe Price’s Schedule 13G/A, as filed with the SEC, certified that it acquired the shares of our common stock in the ordinary course of business and not for the purpose of changing or influencing the control of the Company. |
4 | According to their report on Schedule 13G/A, filed on February 5, 2020, BlackRock, Inc. (“BlackRock”) was deemed to beneficially own 1,200,765 shares, or 7.3%, of our common stock as of December 31, 2019. According to the Schedule 13G/A, BlackRock had sole power to vote 1,160,775 shares and to dispose of 1,200,765 shares. BlackRock’s Schedule 13G/A, as filed with the SEC, certified that it acquired the shares of our common stock in the ordinary course of business and not for the purpose of changing or influencing the control of the Company. |
5 | According to their report on Schedule 13G/A, filed on February 12, 2020, The Vanguard Group (“Vanguard”) was deemed to beneficially own 1,074,976 shares, or 6.55%, of our common stock as of December 31, 2019. According to the Schedule 13G/A, Vanguard had sole power to vote 33,547 shares and to dispose of 1,035,882 shares. Vanguard’s Schedule 13G/A, as filed with the SEC, certified that it acquired the shares of our common stock in the ordinary course of business and not for the purpose of changing or influencing the control of the Company. |
CHESAPEAKE UTILITIES CORPORATION - 2020 Proxy Statement - 25
Delinquent Section 16(a) Reports
Section 16(a) of the Board and Corporate Governance Committee Self-Evaluations. The ChairsExchange Act requires each of the Audit CommitteeCompany's directors and Compensation Committee receive a reportexecutive officers, and any beneficial owner of more than 10% of our common stock, to file reports with the SEC. These include initial reports and reports of changes in the individual’s beneficial ownership of our common stock. Such persons are also required by SEC regulations to furnish the Company with copies of such reports. Other than T. Rowe Price, which owns 14.07% of the resultsCompany's outstanding shares of their respective Committee Self-Evaluations. The Committee Self-Evaluation resultscommon stock, we are discussed at Committee meetings and reported to the Board at the next Board meeting. The Chairnot aware of any person or entity that beneficially owns more than 10% of our common stock as of the Corporate Governance Committeedate this Proxy Statement is filed with the SEC. To our knowledge, based solely on a review of (i) the Section 16 reports the resultswe filed on behalf of the Board Self-Evaluation atCompany's directors and executive officers, (ii) all Section 16(a) reports furnished to us, and (iii) the next Board meeting.written representations made by such persons that no other reports were required, we believe that during the year ended December 31, 2019 all directors, executive officers, and holders of more than 10% of our common stock, filed on a timely basis the reports required by Section 16(a) except for a late filing of a Form 4 to report a sale by Mr. Thompson. In addition, a Form 4 filed for Mr. Thompson in 2019 reported an acquisition of shares of our common stock pursuant to an inheritance that occurred in 2018. Mr. Thompson retired effective December 31, 2019.
6 - OUR ENGAGING CULTURE
Communications with the Board, Stockholders, and the Financial Community
and Other Interested Parties
Communications with the Board.Stockholders and other parties interested in communicating directly with the Board, a committee of the Board, any individual director, the director who presides at executive sessions of the non-management or independent directors, or the non-management or independent directors, in each case, as a group, may do so by sending a written communication to the attention of the intended recipient(s) in care of the Corporate Secretary at Chesapeake Utilities Corporation, 909 Silver Lake Boulevard, Dover, Delaware 19904. All communications must be accompanied by the following information: (i) if the person submitting the communication is a stockholder, a statement of the type and amount of securities of the Company that the person holds; (ii) if the person submitting the communication is not a stockholder and is submitting the communication to the non-management or independent directors as an interested party, the nature of the person’s interest in the Company; (iii) any special interest of the person in the subject matter of the communication; and (iv) the address, telephone number and email address, if any, of the person submitting the communication.
The Corporate Secretary will forward all appropriate communications to the intended recipient(s). Communications relating to accounting, internal controls or auditing matters are handled in accordance with procedures established by the Audit Committee with respect to such matters. These communications proceduresCommittee. The independent directors have been unanimously approved bythese communications procedures. In 2019, nine of our eleven directors serving from our May 2018 to May 2019 Annual Meeting were in attendance at the independent directors.2019 Annual Meeting of Stockholders.
Communications with Stockholders and the Financial Community.In additionOur management team conducts outreach to stockholders and the financial community throughout the year to obtain input and to inform our management team and the Board about matters of interest. Input is regularly shared with the Board and its Committees at their scheduled meetings and through interim updates given to the above,Board. During the year, we present information ongenerally discuss our strategy, financial and operational performance, macroeconomics, as well as corporate governance, sustainability and compensation matters with stockholders and the Company at the American Gas Association’s Annual Financial Forum, where we havefinancial community. In 2019, management participated in several investor roadshows and industry conferences which provided management the opportunity to communicate with security analysts, portfolio managers, investors, rating agencies and investment bankers. Those attending the presentationconferences have an opportunity to ask questionsreceive information about the Company and interact with the management team. Annually, we conduct road showsManagement also interacts with investors on a routine basis including, but not limited to, certain events and participatevenues as illustrated below. Communications made during outreach efforts are done so in industry conferences where current and potential investors, as well as other members of the financial community, receive information about the Company. On August 11, 2016 the Company hosted its first annual Investor Day to discuss the Company's growth strategy, current businesses, and financial results. Participants were also invited to attend a tour of Eight Flags Energy's Combined Heat and Power plant. We also hold quarterly conference calls to discussaccordance with our financial resultsRegulation FD policy.
Engagement with stockholdersour Stockholders and the financial community. In addition, a presentation is given to investors immediately following our Annual Meeting of Stockholders. In 2016, all of the directors were in attendance at the Annual Meeting of Stockholders.

CHESAPEAKE UTILITIES CORPORATION - 20172020 Proxy Statement - 2526
Environmental, Social and Governance ("ESG")
For more than 160 years, Chesapeake Utilities has grown responsibly and with financial discipline to meet the evolving needs of our customers. We are a trusted energy delivery company providing safe, reliable, sustainable and efficient energy solutions. At Chesapeake Utilities, we know that the services we provide contribute to the comfort and economic well-being of our customers and communities. As technology continues to advance and customer preferences evolve, environmental, social and governance initiatives are informing our operational decision-making and business strategies. Our energy delivery solutions continue to play a key role in bringing value in real time to our customers. The Corporate Governance Committee oversees the Company's ESG activities and practices to continue enhancing our culture of sustainability and corporate governance practices. Consistent with our culture of teamwork, the broad reach of ESG is supported across our organization by the dedication and efforts of our Board and each Committee, as well as the entrepreneurship and drive of our team. In 2019, the management team and employees from across our businesses joined together to further discuss our sustainability initiatives. Additionally, our team collaborates with various industry and trade organizations, as well as other companies, to evaluate evolving ESG practices. We include information on our long-standing commitment to sustainability and ESG in our earnings calls presentations and discuss sustainability with stockholders and the financial community. We welcome the opportunity to discuss our long-standing ESG practices and appreciate the recognition the Company has received as a leader in ESG initiatives during our roadshows in 2019. Together, we celebrate the efforts and recognition of our team companywide by established organizations, several of which are provided below.
| 29 American Gas Associations Safety Achievement Awards earned over the past 17 years | Top Workplace for Eight Consecutive Years | 2019 Governance Team of the Year (small to mid-cap sized companies) by Corporate Secretary Magazine |
| Industry Support of Alternative Fuels award by Eastern Pennsylvania Alliance for Clean Transportation | 2018 Chartwell’s Best Practices in Outage Communications Bronze Award for mid-size utilities for its Hurricane Irma community engagement campaign | 2018 Best for Corporate Governance Among North American Utilities by Ethical Boardroom Magazine |
| 2018 Air Quality Awareness Champion by Clean Cities Coalition | 2017 Industry Excellence Award for our Eight Flags Energy CHP Plant by Southeastern Electric Exchange, Inc. | 2017 Best Gas Company on the Eastern Shore and Sussex County, Metropolitan Magazine |
Additional information on our ESG practices can be viewed in our 2019 Annual Report to Stockholders, on our website and our Investor Relations App.
7 - DIRECTOR AND EXECUTIVE COMPENSATION
2013 Stock and ManagementIncentive Compensation Plan
| Name of Beneficial Owner | Qualified 401(k) Retirement Savings Plan | Non-Qualified Deferred Compensation Plan(1) | Total Shares Owned Beneficially(2)(3) | Percent of Class | ||||
| Eugene H. Bayard | — | — | 29,366 | * | ||||
| Elaine B. Bittner | 7,746 | 2,721 | 32,177 | * | ||||
| Thomas J. Bresnan | — | 8,862 | 19,603 | * | ||||
| Beth W. Cooper | 11,569 | 14,414 | 65,933 | * | ||||
| Ronald G. Forsythe, Jr. | — | 2,285 | 2,769 | * | ||||
| Thomas P. Hill, Jr. | — | 6,414 | 27,781 | * | ||||
| Jeffry M. Householder | — | 7,527 | 9,619 | * | ||||
| Dennis S. Hudson, III | — | — | 11,220 | * | ||||
| Paul L. Maddock, Jr. | — | — | 46,317 | * | ||||
| Michael P. McMasters | 19,568 | 43,710 | 141,370 | * | ||||
| Calvert A. Morgan, Jr. | — | — | 43,354 | * | ||||
| Dianna F. Morgan | — | — | 12,010 | * | ||||
John R. Schimkaitis(4) | — | — | 145,112 | * | ||||
| Stephen C. Thompson | 22,043 | — | 92,793 | * | ||||
| Executive Officers and Directors as a Group | 60,926 | 85,933 | 679,424 | 4.16 | % | |||
| * Less than one percent. | ||||||||
| Name of Investment Advisor | ||||||||
T. Rowe Price Associates, Inc.(5) 100 E. Pratt Street Baltimore, MD 21202 | — | — | 1,538,892 | 9.40 | % | |||
BlackRock, Inc.(6) 55 East 52nd Street New York, NY 10055 | — | — | 972,470 | 6.00 | % | |||
CHESAPEAKE UTILITIES CORPORATION - 20172020 Proxy Statement - 2627
Director Compensation
The Compensation Committee, which consists solely of independent directors, reviews director compensation annually to ensure the appropriate compensation arrangements are in place for non-employee directors. The Committee subsequently reports its findings and any recommendations to the Board. The Board approves all director compensation arrangements. A director who is also an employee of the Company receives no additional compensation for his or her service as a director.
Each non-employee director receives cash and equity compensation for his or her service on the Board. In May 2016,2019, the Board approved several changes toreviewed non-employee director compensation asand determined that changes to the non-employee director compensation were appropriate. The amounts approved by the Board are reflected in the table below. Directors may not elect to receive their cash compensation in stock.stock or vice versa. Directors are also reimbursed for business expenses incurred in connection with attending meetings and performing other Board-related services, including external director education.
| 2016 Annual Meeting until the 2017 Annual Meeting | 2015 Annual Meeting until the 2016 Annual Meeting | 2019 Annual Meeting until the 2020 Annual Meeting | 2018 Annual Meeting until the 2019 Annual Meeting | |||||||||||||
Board Retainers(1) | ||||||||||||||||
| Board Member - Cash | $ | 70,000 | $ | 65,000 | ||||||||||||
Board Member - Equity(2) | $ | 60,000 | $ | 55,000 | ||||||||||||
Board Retainers - Cash(1) | ||||||||||||||||
| Board Member | $ | 80,000 | $ | 80,000 | ||||||||||||
| Board Chair | $ | 65,000 | $ | 65,000 | $ | 75,000 | $ | 75,000 | ||||||||
Committee Retainers(3) | ||||||||||||||||
Board Retainers - Equity(2) | ||||||||||||||||
| Board Member | $ | 70,000 | $ | 60,000 | ||||||||||||
Committee Retainers - Cash(3) | ||||||||||||||||
| Committee Member | $ | 5,000 | $ | 5,000 | $ | 5,000 | $ | 5,000 | ||||||||
| Audit Committee Chair | $ | 12,000 | $ | 12,000 | $ | 14,000 | $ | 14,000 | ||||||||
| Compensation Committee Chair | $ | 10,000 | $ | 10,000 | $ | 12,000 | $ | 12,000 | ||||||||
| Corporate Governance Committee Chair | $ | 8,000 | $ | 8,000 | $ | 10,000 | $ | 10,000 | ||||||||
1 | No additional compensation is received for attendance at a Board or Committee meeting. The Chair of the Board receives a cash retainer that is in addition to the Board Member retainer. |
2 | Fractional shares are rounded down to the nearest whole number. Fractional shares are paid in cash. |
3 | In addition to Board retainers, Committee members receive a retainer fee for each Standing Committee on which he or she |
Directors may defer all or a portion of their annualBoard or Committee retainers in accordance with the Chesapeake Utilities Corporation Deferred Compensation Plan, which is further described in the Non-Qualified Deferred Compensation Plan (the “Non-Qualified Deferred Compensation Plan”) which is described in detail on page 48 section in this Proxy Statement. Deferrals made under the Non-Qualified Deferred Compensation Plan are on a pre-tax basis until the director's separation from service with the Company and its affiliates or another specified date. At all times, directors have a 100 percent100% vested interest in the amount of cash or stock that is deferred.
Director Stock Ownership
In 2016, the Board reviewed the stock ownership and retention guidelines for non-management directors and approved changes to theaccordance with our Corporate Governance Guidelines, to better align the Company's stock ownership requirement for non-management directors with best practices. The Company requires that each non-management director shallis required to own, beneficially and of record, thata number of shares of our common stock of the Company that havewith a total market value equalthat meets or exceeds a threshold established by the Board from time to not less thantime. This ownership threshold is currently five times the amount of the annual cash retainer in effect on February 24, 2017 and payable to a non-management director for service on the Board for a non-management director at the time such director is appointed or elected to the Board (excluding any(the "Director Stock Ownership Requirement"). The cash retainer receivedpayable to directors for Committee service on a committee of the Board or as Chair of the Board) (the “Director Stock Ownership Requirement”).is not taken into account for this purpose. Each non-management director shall havemust comply with the Director Stock Ownership Requirement within five years from the later of (i) the date of such director’s initial appointment or election to the Board and (ii) December 6, 2017, the effective date of the effectiveness of these director stock ownership guidelines to comply(the "Ownership Period"). A director shall be in compliance with the director stock ownership guidelines if he or she satisfies the Director Stock Ownership Requirement (the “Compliance Period”). Once a director has reachedat any time during the Director Stock Ownership Requirement, that director will remain in compliance withPeriod and then continues to own not less than the Director Stock Ownership Requirement so long as such director shall maintain record and beneficial ownership of such number of shares of common stock of the Company owned at the time the Director Stock Ownership Requirement is met for director’s entire term of service on the Board regardlessdate of such compliance (taking into account any changes to the annual cash retainer for non-management directorsstock split or fluctuations in the Company's stock price. Should a non-management director at any time following the Compliance Period cease to comply with the Director Stock Ownership Requirement, thecombination transactions). The Corporate Governance Committee, in its sole discretion, may reviewconsider the circumstances surrounding any shortfall in ownership by a director and address any such shortfall in ownershipsituation as it deems appropriate. All non-employee directors currently own shares of stock exceeding this thresholdexceed the Director Stock Ownership Requirement or will continue to acquire shares in an effort to achieve their requisite ownershipare within the established timeframe.applicable Ownership Period for achievement of the Director Stock Ownership Requirement.
CHESAPEAKE UTILITIES CORPORATION - 2020 Proxy Statement - 28
Independent Compensation Consultant's Report
In May 2016,2019, the Compensation Committee received a Non-Employee Director Compensationnon-employee director compensation presentation (the “Analysis”) prepared by Cook & Co.FW Cook. The Analysis compared our then current director compensation arrangements against the Company’sCompany's compensation peer group and a broader utility industry.energy industry survey group. The peer group used for the purposes of this Analysis is the same group of companies used to evaluate the Company’sCompany's executive compensation program. The Analysis reviewed various elements of director compensation, including annual cash and equity retainers, meeting fees, and committee compensation. The Compensation Committee, reviewedafter reviewing, discussing, and discussed the Analysis that was prepared by Cook & Co. The Compensation Committee, after consideration ofconsidering the Analysis and other relevant factors, recommended to the Board increasesthat changes be made to the Board cash and equity retainers to further alignnon-employee director compensation with that of the peer group and broader industry.compensation. The Board approved the Compensation Committee's recommendations at its meeting held in May 2016, as2019 and approved changes to non-employee director compensation, which are reflected in the Non-employeetable provided in the Non-Employee Director Compensation Table on page 27.section of this Proxy Statement. In the future, the Board may modify director compensation as it deems appropriate.
The following table reflects compensation paid to non-employee directors in 2019 (unless otherwise noted below) for services performed during 2016:
on the Board from the 2019 Annual Meeting of Stockholders until the 2020 Annual Meeting of Stockholders:
| 2016 Director Compensation | ||||||
| Name | Fees Earned or Paid in Cash(1) ($) | Stock Awards(2) ($) | Total(3) ($) | |||
| Eugene H. Bayard | 75,000 | 59,944 | 134,944 | |||
Thomas J. Bresnan(4) (5) | 87,000 | 59,944 | 146,944 | |||
Ronald G. Forsythe, Jr. (5) | 75,000 | 59,944 | 134,944 | |||
Thomas P. Hill, Jr. (4) (5) | 75,000 | 59,944 | 134,944 | |||
| Dennis S. Hudson, III | 80,000 | 59,944 | 139,944 | |||
| Paul L. Maddock, Jr. | 75,000 | 59,944 | 134,944 | |||
Calvert A. Morgan, Jr. (4) | 88,000 | 59,944 | 147,944 | |||
| Dianna F. Morgan | 85,000 | 59,944 | 144,944 | |||
John R. Schimkaitis(4) | 135,000 | 59,944 | 194,944 | |||
| 2019 DIRECTOR COMPENSATION | |||||||||||||||||
Director Name(1) | Fees Earned or Paid in Cash(2) | Stock Awards(3) | Total(4) | ||||||||||||||
| Eugene H. Bayard | $ | 85,052 | $ | 69,948 | $ | 155,000 | |||||||||||
Thomas J. Bresnan(5) | $ | 104,052 | $ | 69,948 | $ | 174,000 | |||||||||||
Ronald G. Forsythe, Jr.(5) | $ | 90,052 | $ | 69,948 | $ | 160,000 | |||||||||||
Thomas P. Hill, Jr.(5) | $ | 90,052 | $ | 69,948 | $ | 160,000 | |||||||||||
| Dennis S. Hudson, III | $ | 90,052 | $ | 69,948 | $ | 160,000 | |||||||||||
Lila A. Jaber(6) | $ | 27,851 | $ | 24,341 | $ | 52,192 | |||||||||||
| Paul L. Maddock, Jr. | $ | 85,052 | $ | 69,948 | $ | 155,000 | |||||||||||
| Calvert A. Morgan, Jr. | $ | 105,052 | $ | 69,948 | $ | 175,000 | |||||||||||
| Dianna F. Morgan | $ | 102,052 | $ | 69,948 | $ | 172,000 | |||||||||||
John R. Schimkaitis(5) | $ | 160,052 | $ | 69,948 | $ | 230,000 | |||||||||||
1 | Jeffry M. Householder was appointed to serve as a director and our President and Chief Executive Officer effective January 1, 2019. Mr. Householder does not receive compensation for his services as a director or Chair of the Investment Committee. |
2 | The Fees Earned or Paid in Cash column reflects Board and Committee retainers paid in May |
3 | The Stock Awards column reflects the grant date fair value of the prorated award on May |
4 | There is no compensation that needs to be included in the Option Awards, Non-equity Incentive Plan Compensation, or Change in Pension Value and Non-Qualified Deferred Compensation Earnings or All Other Compensation columns. Dividends on deferred stock units in the Deferred Compensation Plan (which are settled on a one for one basis in shares of common stock) are the same as dividends paid on the Company’s outstanding shares of common stock. Additionally, cash retainer compensation deferred under the Deferred Compensation Plan has investment crediting options that are the same as investment options available to all employees under the Company's Retirement Savings Plan. As a result, the directors participating in the Deferred Compensation Plan do not receive preferential earnings on their investments. Directors do have the ability to purchase propane at the same discounted rate that we offer to our employees, the value of which, when combined with all other perquisites and personal benefits, does not exceed $10,000 in the aggregate. |
| The following directors deferred their annual stock retainer as follows: Bresnan - $69,948; Forsythe - $69,948; Hill |
6 | Lila A. Jaber was appointed to serve as a director effective January 1, 2020. Effective with her appointment, Ms. Jaber received a cash payment of $27,851 for the prorated Board retainer and fractional shares paid in cash for services to be performed from January 1, 2020 through May 7, 2020. The Stock Award column reflects a grant date fair value of $24,341 (254 shares based on a price per share of $95.83, the closing price on December 31, 2019). The stock award is fully vested in that it is not subject to forfeiture. |
CHESAPEAKE UTILITIES CORPORATION - 2020 Proxy Statement - 29
Report of the Compensation Committee on Compensation Discussion and Analysis
The Compensation Committee has reviewed and discussed the Compensation Discussion and Analysis with the Company’sCompany's management. The Compensation Committee, based on its review and discussions, has recommended to the Board that the following Compensation Discussion and Analysis be included in this Proxy Statement and filed with the SEC.
The information in this Report shall not be considered “soliciting material,” or to be “filed” with the SEC nor shall this information be incorporated by reference into any previous or future filings under the Securities Act of 1933, as amended, or the Securities Exchange Act, of 1934, as amended, except to the extent that the Company incorporated it by specific reference.
This reportReport is provided by the following independent directors who comprise the Compensation Committee:
THE COMPENSATION COMMITTEE
 | |  |  |
| Dianna F. Morgan, Chair | Ronald G. Forsythe, Jr. | Dennis S. Hudson, III | Calvert A. Morgan, Jr. |
Compensation Discussion and Analysis
Throughout the Compensation Discussion and Analysis section of this Proxy Statement, we will provide information on the Company's NEOs, the structure and components of our executive compensation program, as well as various considerations and actions taken throughout the year by the Compensation Committee as it relates to the compensation for the NEOs.
Named Executive Officers
 |  |  | ||||
In this section, we identify five individuals in accordance with Item 402(a)(3) of Regulation S-K. These individuals are collectively referred to as the "Named Executive Officers" or "NEOs."
The following employees were Named Executive Officers in 2019:
Jeffry M. Householder, President and CEO
James F. Moriarty, Executive Vice President, General Counsel, Corporate Secretary and Chief Policy and Risk Officer
Beth W. Cooper, Executive Vice President, CFO and Assistant Secretary
Kevin J. Webber, Senior Vice President
Stephen C. Thompson, Retired Senior Vice President
Stephen C. Thompson retired from the Company effective December 31, 2019 after thirty-six years of service with the Company. We acknowledge Mr. Thompson's leadership, performance and commitment to the Company, as well as his dedication to its stakeholders, including its employees, customers, investors and the communities we serve. References throughout this Proxy Statement to the "Executive NEOs" include Messrs. Householder, Moriarty and Webber, and Ms. Cooper.
The NEOs have more than 150 years of collective energy industry experience. Our entire Chesapeake Utilities team is dedicated to providing value added services to our stockholders and the communities we serve. We refer you to our Strategic Growth section in this Proxy Statement where we discuss our strong growth across the Company’s regulated and unregulated energy businesses as evidenced by our record high net income and EPS in 2019. We intend to build upon our strong foundation in further pursuit of new growth opportunities and increased efficiencies.
CHESAPEAKE UTILITIES CORPORATION - 20172020 Proxy Statement - 2930
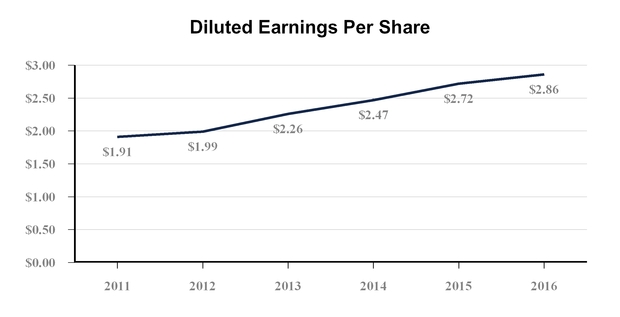
| Strong Performance in 2019 | As a result of the collective efforts of the Chesapeake Utilities team, we generated strong financial results in 2019, including for those metrics that are tied to performance-based compensation. | |
• | EPS: The growth and initiatives pursued by our businesses resulted in basic 2019 EPS of $3.97 per share (versus $3.46 per share in 2018). | |
• | ROE: ROE was 12% (or 11.3% on a continuing basis) as a result of growing earnings from a stable utility foundation and investing in related businesses and services that provide opportunities for returns greater than traditional utility returns. | |
• | TSR: Over the long term, our strategic growth has led to a compound annual total shareholder return that has exceeded 14% for the past 3, 5, 10 and 20 year periods ended December 31, 2019. In 2019, the Board increased | |
• | Capital Investments: Future growth is generated in part from successfully identifying and making profitable capital investments. We continued to invest in high levels of capital expenditures, with an investment of $199 million in capital expenditures in 2019. | |
| Strategic Growth | We are focused on identifying and developing opportunities across the energy value chain, with emphasis on midstream and downstream investments that are accretive to earnings per share and consistent with our long-term growth strategy. Our diverse asset base includes a utility foundation with upside from our complementary unregulated energy businesses. We are continuing to pursue and develop new growth opportunities and regulatory strategies that build upon our core platform. In 2019, we generated $25.0 million in additional gross margin reflecting strong growth across our regulated and unregulated energy businesses (exclusive of the natural gas marketing business which was sold in 2019). In terms of continuing operations, this represents the largest level of gross margin increase (measured in dollars) in our history. Overall, the growth and initiatives pursued by our businesses in 2019 resulted in strong performance across the Company. See the Strategic Growth section in this Proxy Statement for additional information. | |
| Executive Compensation Program | The executive compensation program is designed to focus executive officers on both short-term and long-term financial and operational performance of the Company. Performance-based incentive awards comprised between 71% to 81% of base salary and incentive compensation in 2019 (including one-time transitional equity awards) for each Executive NEO. The compensation program for the Executive NEOs is comprised of the following components: | |
• | Base Salary is a fixed compensation element that is set at competitive levels in order to attract and retain executive officers with skills and attributes that align with our culture and strategic goals. | |
| • | Short-Term Cash Incentive Compensation is one of two at-risk compensation elements that incentivizes Executive NEOs upon the achievement of pre-established financial and non-financial performance metrics over an annual period. | |
• | Long-Term Equity Incentive Compensation is the second at-risk compensation element that incentivizes Executive NEOs upon the achievement of pre-established financial performance metrics over a three-year performance period. | |
• | Executive NEOs participate in the same benefits that are available to other employees. | |
CHESAPEAKE UTILITIES CORPORATION - 20172020 Proxy Statement - 3031
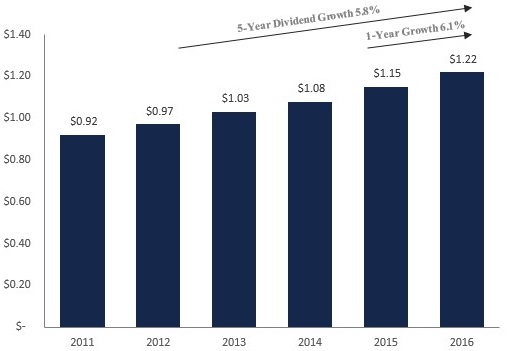
| Determination of Compensation | The Compensation Committee aims to provide a fair, reasonable and competitive executive compensation program that aligns compensation to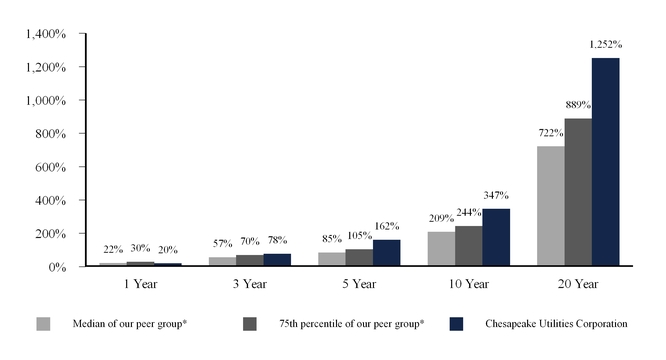 | |
• | Independent Consultant Review: To assess the competitiveness of our executive compensation program, the Compensation Committee engages an independent compensation consultant, FW Cook. | |
• | Peer Comparison: FW Cook prepares a market analysis that compares our compensation practices against those of our compensation peer group and a broader energy industry survey group, which is reviewed and discussed by the Compensation Committee. | |
• | Market Median: In the market analysis, FW Cook concluded that the target total direct compensation for the NEOs was, in aggregate, slightly below a competitive range of the market median of the Company's peer group. | |
• | Benchmarking Performance: Our short-term and long-term incentive programs include financial metrics that are benchmarked against the peer group. | |
• | Say-on-Pay: The Compensation Committee will consider advisory stockholder votes in the future when determining executive compensation. The Board adopted annual say-on-pay advisory votes as supported by our stockholders. The next advisory vote on the frequency of future say-on-pay advisory votes will occur at the 2023 Annual Meeting of Stockholders. | |
| Compensation Practices | Our processes and controls related to the executive compensation program mitigate unnecessary risk-taking. | |
• | Process and Controls:Our short-term and long-term incentive programs: (i) utilize multiple performance criteria; (ii) allow our Compensation Committee to adjust awards based on individual performance; (iii) require the Audit Committee to review the relevant financial results prior to the issuance of any award; and (iv) feature a cap on the maximum amount that can be earned during any performance period. | |
• | Stock Ownership Guidelines:Our stock ownership guidelines require the Executive NEOs to retain a certain number of shares over the applicable time period, which encourages long-term ownership in the Company, aligns interests with the Company's stockholders, and mitigates potential compensation-related risk. | |
| Key Compensation Decisions | In 2019, the Compensation Committee approved the following payouts under the compensation program for base salary, short-term cash, and long-term equity. | |
• | Increased Salaries: For 2019, each NEO's respective base salary increased after considering a market analysis by FW Cook, the NEO's role and scope of responsibilities, prior performance, and the competitive nature of our business. | |
• | Short-Term Incentive Payout: Cash incentive award payouts for the NEOs as provided in the Summary Compensation Table ranged from 135% to 153% of each NEO's respective target opportunity based on performance over the period from January 1, 2019 through December 31, 2019. | |
• | Long-Term Incentive Payout: Equity and long-term cash incentive award payouts were 132% to 174% of each NEO's respective target opportunity based on performance over the period from January 1, 2017 through December 31, 2019. | |
CHESAPEAKE UTILITIES CORPORATION - 20172020 Proxy Statement - 3132
As a result of the collective efforts of the Chesapeake Utilities team, we generated strong financial results in 2019, including with respect to those metrics that are used to measure performance-based compensation. 2019 net income and EPS reached a record high. The Company's net income for the year ended December 31, 2019 was $65.2 million, or $3.97 per share (basic), versus $3.46 per share in 2018. Higher earnings for 2019 reflect increased gross margin from recently completed and ongoing pipeline expansion projects, incremental margin from the acquisition of certain assets of Marlin Gas Transport, R.F. Ohl Fuel Oil, Inc. and Boulden Inc., organic growth in the natural gas distribution operations, and higher retail propane margins. A Florida Public Service Commission regulatory order that enabled the Company to retain tax savings associated with lower federal tax rates resulting from the United States Tax Cuts and Jobs Act in several natural gas distribution operations and continued growth in gross margin from Aspire Energy also contributed to higher earnings growth in 2019. During the year, we also completed the sales of the assets and contracts of our natural gas marketing subsidiary, PESCO and recorded a pre-tax gain of $7.3 million ($5.4 million after tax). These growth drivers, coupled with the gain on the sale of PESCO, overcame $4.9 million in lower gross margin due to a decline in customer consumption as a result of warmer weather in 2019 compared to 2018. Our strong financial results translated into a 12% ROE, or an 11.3% ROE from continuing operations. Over the past five years, we have generated an annual ROE ranging from 11.0% to 13.0%, which represents top quartile performance over the long-term when compared to our performance peer group. Our ROE has been driven by our innovative approach to cultivate, develop and consummate growth projects and initiatives and generating higher returns from our unregulated energy businesses. The efforts of the Chesapeake Utilities team throughout 2019 have positioned us for continued future growth in 2020 and beyond.
BASIC EARNINGS PER SHARE 5-Year CAGR Earnings Growth - 9.9% Reported net income for 2019 was $65.2 million, or $3.97 per share compared to $56.6 million, or $3.46 per share for 2018. The Company's net income from continuing operations for 2019 increased to $61.1 million, or $3.73 per share, from $56.9 million, or $3.48 per share in 2018, representing a growth rate of over 7%. Continued growth across our businesses, the acquisition of certain assets, organic growth in the natural gas distribution operations, and higher retail propane margins were the most significant contributors to higher earnings in 2019. Our basic earnings per share for 2015 through 2019 is as follows: | ANNUALIZED DIVIDEND GROWTH 5-Year CAGR Dividend Growth – 8.5% Chesapeake Utilities has paid dividends to its stockholders without interruption for 59 years. During those 59 years, we have either maintained or increased our annualized dividend. Over the past five years, the annual dividend increase has grown from 6.5% in 2015 to 9.5% in 2019. The Board increased the annualized dividend in 2019 by $0.14 per share, or 9.5% over the prior year reflecting our commitment to stockholder value through dividend growth that is cultivated from sustainable earnings growth. This resulted in an annualized dividend of $1.62 per share in 2019. Our annualized dividend per share from 2015 through 2019 is as follows: | |
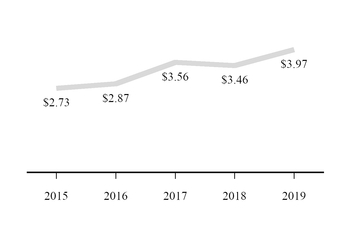
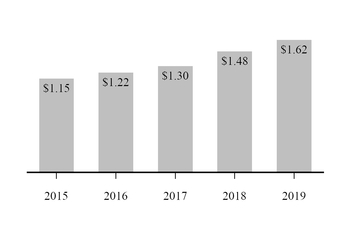
TOTAL SHAREHOLDER RETURN
The combination of dividends and stock price appreciation for 2019 produced an annual total return to our stockholders of approximately 20% for the one year period ended December 31, 2019, and over 14% for the past 3, 5, 10 and 20 year periods ended December 31, 2019. Chesapeake views its performance as an investment over the longer term, as there can be more volatility during shorter periods of time. The table below reflects Chesapeake's total shareholder return over the long-term as compared to our peer group. See the performance peer group in the Companies in Our Peer Group Section of this Proxy Statement for more information.
CHESAPEAKE UTILITIES CORPORATION - 2020 Proxy Statement - 33
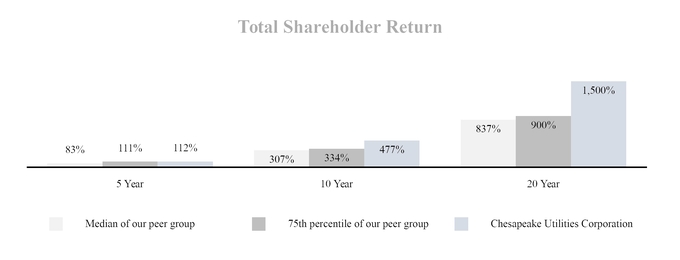
INVESTING FOR FUTURE GROWTH
Over the 5 years ended December 31, 2019, we have made capital investments totaling approximately 80% of total capitalization
Future growth is generated in part from the success in identifying and making profitable capital investments that accelerate change and fuel future earnings growth and new opportunities. Our performance in 2019 is driven in part by our steadfast commitment to pursuing growth opportunities with discipline, determination and drive. Our results in 2016 are a culmination of the growth efforts that we initiated several years ago.have been underway for some time coupled with our ability to identify and drive other earnings opportunities including new pipeline expansion projects, distribution extensions to new areas, new acquisitions, and new unregulated service offerings. Our earnings growth, because of the significance of our regulated operations, is driven by the additional capital investments we make. To sustain or increase our earnings growth rate, we invest in additional capital expenditures that generate returns equal to or greater than their respective target returns.
We continued to expend high levels of capital expenditures,this strategy with an investment of $169.4$199 million in new capital expenditures in 2016.2019. We have invested approximately $669 million$1 billion over the last five years, which represents approximately 83 percent80% of the Company's total capitalization of $805 million$1.3 billion at December 31, 2016.2019. The followingchart below reflects annual capital expenditures (including acquisitions) to average total capitalization for the 12twelve months ended December 31.31 for the most recent five fiscal years.
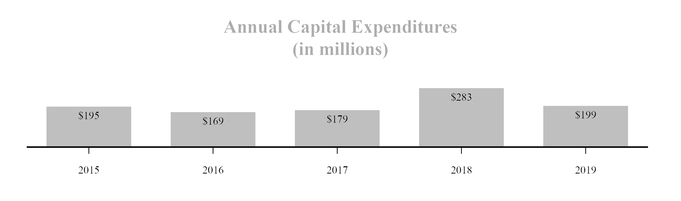
Strategic Growth
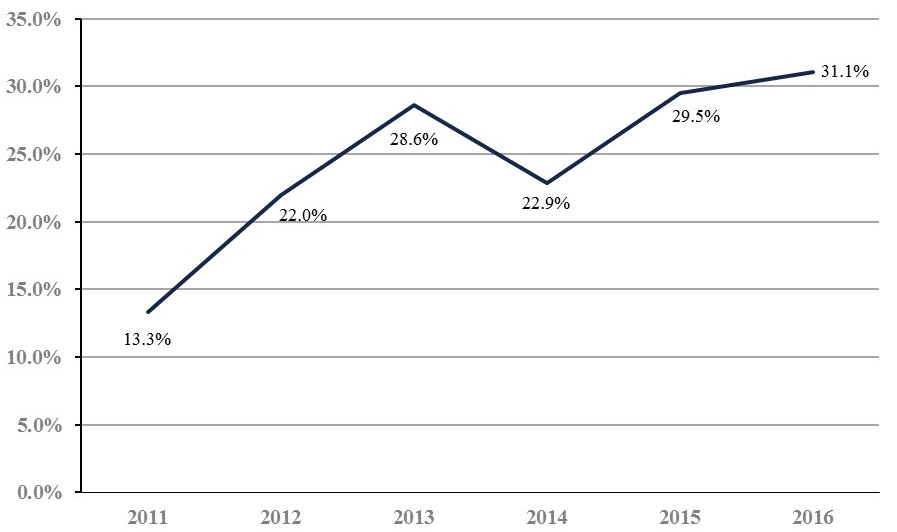
2019 Basic EPS (GAAP) of $3.97 per share compared to $3.46 per share for 2018, an increase of $0.51 per share or 14.7%
2019 Basic EPS from continuing operations was $3.73, an increase of $0.25 or 7.2% over 2018
CHESAPEAKE UTILITIES CORPORATION - 2020 Proxy Statement - 34
Natural gas expansion projects, customer growth and conversions generated $18.3 million in additional gross margin in 2019
Unregulated energy acquisitions added $6.8 million in incremental gross margin in 2019
Boulden and Elkton Gas acquisitions along with pipeline expansion projects, expected to further enhance growth going forward
We successfully exited the natural gas marketing business through the sale of the assets and contracts for PESCO resulting in a pre-tax gain of $7.3 million ($5.4 million after tax)
The Company issued $70.0 million of 2.98% uncollateralized senior notes in December 2019 to fund new growth capital investments
Executive Compensation Program
The executive compensation program is designed to focus executive officers on both short-term and long-term financial and operational performance, without encouraging unnecessary risk. The Compensation Committee retains discretion in administering all awards and performance goals, and determining performance achievement. The following provides the components of our executive compensation program.
| TOTAL DIRECT COMPENSATION FOR THE EXECUTIVE NEOs | ||
| Base Salary | • | Base salaries are set at competitive levels to attract and retain executive officers that have the knowledge and skills necessary to achieve the Company's established goals |
| • | The Compensation Committee considered the following, among other factors, when setting 2019 base salaries: scope of the executive’s responsibilities, prior year’s performance, internal equity and the competitive nature of our business | |
| Short-Term Incentive Compensation | • | The 2015 Cash Plan, under which cash incentive awards may be granted, was approved by the Company's stockholders in May 2015 |
| • | In February 2019, the Compensation Committee granted cash incentive awards for the performance period January 1, 2019 through December 31, 2019 | |
| 1-year Performance Based Award | • | Evaluation of performance is based on achieving financial and non-financial targets |
| • | Awards are subject to a cap of 200% of target on the maximum amount that can be earned during any performance period, as well as an absolute dollar limit set under the terms of the 2015 Cash Plan | |
| Long-Term Incentive Compensation | • | The SICP, under which equity incentive awards may be granted, was approved by the Company's stockholders in May 2013 |
| • | In February 2019, the Compensation Committee granted 2019 Equity Incentive Awards which are based upon a three-year performance period ending December 31, 2021; in December 2019, the Executive NEOs also received transitional equity awards for the 2019-2020 and 2019-2021 performance periods in connection with their increased responsibilities in 2019 | |
| 3-year Performance Based Award | • | Awards are issued based on achievement of the following performance metrics: TSR, growth in long-term earnings, and ROE |
| • | Awards are subject to a cap of 200% of target on the maximum amount that can be earned during any performance period, as well as an absolute total share award limit set under the terms of the SICP | |
| • | Dividends on the equity incentive awards accrue in the form of dividend equivalents during the performance period and are only paid to the executive if the awards are earned and then only in proportion to the actual shares earned | |
| BENEFIT PLANS AND PERQUISITES AVAILABLE TO CERTAIN EMPLOYEES, INCLUDING EXECUTIVE NEOs | ||
| Pension Plan | • | The Pension Plan and benefits thereunder were frozen as of January 1, 2005. In 2019, the Committee received updates on the Company's Pension Plan de-risking strategy after approval by the Board |
| • | Provides retirement income based on years of service and highest average earnings as of December 31, 2004 | |
| Pension SERP | • | The Pension SERP is an excess plan that covers compensation not included in the qualified plan as a result of IRS compensation limitations |
| • | Provides retirement income under the same terms as the Pension Plan for compensation in excess of tax code limitations | |
| • | Benefits under the Pension SERP have been frozen since January 1, 2005 | |
| • | The Pension SERP does not provide additional benefits or additional future years of service after 2004 | |
CHESAPEAKE UTILITIES CORPORATION - 2020 Proxy Statement - 35
| Retirement Savings Plan | • | The Retirement Savings Plan is available to all eligible employees of the Company and its subsidiaries |
| • | For 2019, employees who participated in the Retirement Savings Plan received matching contributions of up to 6% of eligible cash compensation deferred in the plan up to the applicable statutory compensation limit. The IRS limits the amount of pre-tax contributions that a participant may make to his or her Retirement Savings Plan. | |
| • | Employees of the Company and its subsidiaries, as applicable, are eligible to receive an additional supplemental employer contribution at the discretion of the Company | |
| Deferred Compensation Plan | • | Extends the Retirement Savings Plan, on a non-qualified basis, for deferral of compensation that is in excess of the tax code limitations, as well as for Company matching and supplemental contributions on such excess cash deferrals under the same terms as the Retirement Savings Plan for a select group of management employees |
| • | Select employees of the Company and its subsidiaries, as applicable, are also eligible to receive an additional supplemental employer contribution at the discretion of the Company if such a contribution would have been made in the Retirement Savings Plan absent the compensation limit | |
| • | Cash incentive awards may be deferred and paid at a later, predesignated time. Deferred cash incentive awards are eligible for matching or supplemental contributions by the Company. | |
| • | Equity incentive awards may be deferred for later settlement; any deferred equity awards are not eligible for matching or supplemental contributions | |
| Benefits /Perquisites | • | Executives participate in the same benefits that are available to all employees of the Company |
| • | The All Other Compensation column of the Summary Compensation Table provides benefits where the aggregate value is more than $10,000 | |
| • | On behalf of each employee, the Company pays an annual premium in connection with term life insurance. The life insurance benefit of two times base salary is capped at $500,000, which limits the benefit to highly compensated employees. | |
| • | Company-owned vehicles are available to the Executive NEOs. Company vehicles are treated as imputed income for any personal use of the vehicle and is filed with the IRS on Form W-2. | |
| • | Employees have the ability to purchase propane at a discounted rate | |
The Compensation Committee’sCommittee believes that this compensation program aligns the financial interests of the executive officers with the interests of stockholders. The Committee's approach to executive compensation encompasses practices that focus on a fair, reasonable and competitive executive compensation program while also aligning total compensation towith our business objectives and performance. These practices include, but are not limited to:
performance, thereby focusing on stockholder value. The Compensation Committee retains discretion in administering all awardsmix of base salary and performance goals, and determining performance achievement.
Engaging in hedging transactions related to the Company's stock is prohibited, as well as pledging the Company's stock as collateral for a loan or holding the Company's stock in a margin account
The Company does not provide excise tax gross-up protections.protections
Peer Company(1) | Market Capitalization (millions) | Revenues (millions) | ||||
| Delta Natural Gas Company, Inc. | $ | 209 | $ | 67 | ||
| MGE Energy, Inc. | $ | 2,264 | $ | 545 | ||
| Northwest Natural Gas Company | $ | 1,712 | $ | 676 | ||
| South Jersey Industries, Inc. | $ | 2,678 | $ | 1037 | ||
| Spire Inc. | $ | 2,952 | $ | 1,633 | ||
| Suburban Propane Partners LP | $ | 1,820 | $ | 1,088 | ||
| Unitil Corp | $ | 638 | $ | 383 | ||
2016 Target Cash Incentive Award Opportunity | Weighting for the Performance Targets | Actual Achievement of Performance Targets | Actual Payout Based on Achievement of Performance Targets | ||||||||||||
| Named Executive Officer | Base Salary (as of December 31, 2016) | Bonus Opportunity (% of Base Salary) | Target Cash Incentive Award at 100% | Non- Financial | Financial | Non- Financial | Financial | Non-Financial | Financial | Payout as reflected in the Summary Compensation Table | |||||
| Michael P. McMasters | $580,000 | 60% | $348,000 | 20% | 80% | 175.00% | 75.00% | $121,800 | $ | 208,800 | $330,600 | ||||
| Stephen C. Thompson | $340,000 | 30% | $102,000 | 20% | 80% | 200.00% | 132.50% | $40,800 | $ | 108,120 | $148,920 | ||||
| Beth W. Cooper | $310,000 | 30% | $93,000 | 20% | 80% | 165.00% | 75.00% | $30,690 | $ | 55,800 | $86,490 | ||||
| Elaine B. Bittner | $305,000 | 30% | $91,500 | 20% | 80% | 200.00% | 46.88% | $36,600 | $ | 34,313 | $70,913 | ||||
| Jeffry M. Householder | $305,000 | 30% | $91,500 | 20% | 80% | 200.00% | 67.50% | $36,600 | $ | 49,411 | $86,011 | ||||
Equity Incentive Award Opportunity for the 2016-2018 Performance Period | ||||||||
| Named Executive Officer | Base Salary (approved on February 22, 2016) | Bonus Opportunity (% of Base Salary) | Target Equity Value | Average Closing Stock Price Per Share from 11/1/2015 -12/31/2015 | Target Equity Shares | |||
| Michael P. McMasters | $580,000 | 75% | $ | 435,000 | $53.95 | 8,063 | ||
| Stephen C. Thompson | $340,000 | 50% | $ | 170,000 | $53.95 | 3,151 | ||
| Beth W. Cooper | $310,000 | 50% | $ | 155,000 | $53.95 | 2,873 | ||
| Elaine B. Bittner | $305,000 | 50% | $ | 152,500 | $53.95 | 2,827 | ||
| Jeffry M. Householder | $305,000 | 50% | $ | 152,500 | $53.95 | 2,827 | ||
Peer Company(1) | Market Capitalization (millions) | Revenues (millions) | ||||
| Atmos Energy Corporation | $ | 7,794 | $ | 3,224 | ||
| Delta Natural Gas Company, Inc. | $ | 209 | $ | 67 | ||
| New Jersey Resources Corp. | $ | 3,060 | $ | 1,978 | ||
| NiSource Inc. | $ | 7,155 | $ | 4,493 | ||
| Northwest Natural Gas Company | $ | 1,712 | $ | 676 | ||
| One Gas, Inc. | $ | 3,344 | $ | 1,427 | ||
| RGC Resources, Inc. | $ | 120 | $ | 62 | ||
| South Jersey Industries, Inc. | $ | 2,678 | $ | 1,037 | ||
| Spire Inc. | $ | 2,952 | $ | 1,633 | ||
| WGL Holdings, Inc. | $ | 3,906 | $ | 2,346 | ||
| Total Equity Target Shares for the 2014-2016 Performance Period | Achievement of Performance Components | ||||
| Named Executive Officer | Shareholder Return (30% Weighting) | Growth (35% Weighting) | Earnings Performance (35% Weighting) | Actual Payout for the 2014 - 2016 Performance Period | |
| Michael P. McMasters | 8,634 | 3,885 | 4,533 | 4,533 | 12,951 |
| Stephen C. Thompson | 4,187 | 1,884 | 2,198 | 2,198 | 6,280 |
| Beth W. Cooper | 3,729 | 1,678 | 1,958 | 1,958 | 5,594 |
| Elaine B. Bittner | 3,075 | 1,385 | 1,614 | 1,614 | 4,613 |
| Jeffry M. Householder | 3,578 | 1,610 | 1,878 | — | 3,488 |
| Stock Vested During 2016 | ||
| Named Executive Officer | Number of Shares Acquired on Vesting(1) (#) | Value Realized on Vesting(2) ($) |
| Michael P. McMasters | 12,951 | 871,602 |
| Stephen C. Thompson | 6,280 | 422,644 |
| Beth W. Cooper | 5,594 | 376,476 |
| Elaine B. Bittner | 4,613 | 310,455 |
| Jeffry M. Householder | 3,488 | 234,742 |
Role of the Compensation Committee
Committee. The Compensation Committee is solely responsible for the oversight and administration of our executive compensation program. The Compensation Committee designs, recommends to the Board for adoption as appropriate, and administers the policies and practices related to executive compensation. The Committee, to the extent that it deems appropriate (and, in the case of any of the Company's employee benefit plans, to the extent permitted by the plan), may delegate the day-to-day administration of matters under its authority to employees of the Company, or a subcommittee, subject in all cases to the Committee's oversight responsibility. The Compensation Committee believes that the most effective compensation program is one that is designed to ensure that total compensation is fair, reasonable and competitive. The primary objectives in creating an effective compensation program are to:
Develop an appropriate mix of compensation to enhance performance that aligns the financial interests of the executive officers with the interests of our stockholders;
Structure the program to attract high-quality executive talent that will incentivize performance that focuses on achieving our short and long-term goals; and
Contribute to effective development of talent through internal processes such as performance evaluations, succession planning, and leadership development.
CHESAPEAKE UTILITIES CORPORATION - 2020 Proxy Statement - 36
The Compensation Committee annually reviews the executive compensation program to align (i) the program with the Company’sCompany's objectives; (ii) the components of each element of compensation to arrive at a proper overall compensation level; and (iii) the compensation with that earned by executive officers in comparable positions at peer companies.
Role of Management
Management. The Chief Executive Officer participates in the establishment ofestablishing the compensation targets and payout levels for the other named executive officers. HeNEOs. The Chief Executive Officer assesses the performance for all named executive officersthe NEOs and recommends to the Compensation Committee the overall levels of achievement and the extent to which performance targets were attained. Upon request, named executive officers will provide supplemental materialmaterials are provided by management to the Compensation Committee to assist in making its determinations in regards to the overall levels of achievement. The Chief Executive Officer is not involved in any part of the setting of any component of his compensation. The Chief Executive Officer and other members of senior management attend Compensation Committee meetings only at the invitation of the Compensation Committee.Committee or the Chief Executive Officer.
Role of Independent Compensation Consultant
Consultant.The Compensation Committee has engaged anFW Cook as its independent compensation consultant to assist in reviewing the Company’sCompany's executive compensation program. FW Cook & Co. currently advises the Compensation Committee on executive compensation and non-employee director compensation matters. FW Cook & Co. does not provide any other services to the Company.
Tax Considerations. The Company’s 2019 executive compensation program is similar to the program the Compensation RiskCommittee established in prior years. We refer you to our discussion in the Compensation Discussion and Analysis section of this Proxy Statement for further information regarding our executive compensation program design, including performance-based compensation. Prior to establishing the executive compensation program for the ensuing year, consideration is given to the accounting and tax treatment of certain forms of compensation. Effective January 1, 2019, the United States Tax Cuts and Jobs Act provided that all remuneration in excess of $1 million in a single year, including most performance-based compensation and payable to the Chief Executive Officer, Chief Financial Officer or to any one of the Company’s three most highly compensated executive officers is not deductible for federal income tax purposes.
| COMPENSATION PEER GROUP AND PERFORMANCE PEER GROUP | |||||||||||||||||||
| Compensation Peer Group | Performance Peer Group | ||||||||||||||||||
| Company | In Peer Group | Market Capitalization (in millions at 1/25/2019) | Revenues (in millions) | In Peer Group | Market Capitalization (in millions at latest fiscal year-end reported as of 2/5/2020) | Revenues (in millions) | |||||||||||||
| Atmos Energy Corporation | — | — | — | x | $ | 13,592 | $ | 2,909 | |||||||||||
| Black Hills Corporation | — | — | — | x | $ | 3,767 | $ | 1,755 | |||||||||||
| MGE Energy, Inc. | x | $ | 2,205 | $ | 560 | — | — | — | |||||||||||
| New Jersey Resources Corp. | — | — | — | x | $ | 4,070 | $ | 2,617 | |||||||||||
| NiSource Inc. | — | — | — | x | $ | 9,439 | $ | 5,158 | |||||||||||
| Northwest Natural Holding Co. | x | $ | 1,797 | $ | 725 | x | $ | 1,746 | $ | 704 | |||||||||
| Northwestern Corporation | — | — | — | x | $ | 2,991 | $ | 1,196 | |||||||||||
| ONE Gas, Inc. | — | — | — | x | $ | 4,184 | $ | 1,634 | |||||||||||
| RGC Resources, Inc. | — | — | — | x | $ | 236 | $ | 71 | |||||||||||
| South Jersey Industries, Inc. | x | $ | 2,823 | $ | 1,397 | x | $ | 2,377 | $ | 1,649 | |||||||||
| Spire Inc. | x | $ | 3,906 | $ | 1,965 | x | $ | 4,447 | $ | 1,974 | |||||||||
| Suburban Propane Partners, LP | x | $ | 1,419 | $ | 1,344 | — | — | — | |||||||||||
| Unitil Corporation | x | $ | 726 | $ | 434 | x | $ | 923 | $ | 439 | |||||||||
CHESAPEAKE UTILITIES CORPORATION - 2020 Proxy Statement - 37
Compensation Practices
Process and Controls. We have controls in place that discourage unnecessary risk-taking. The named executive officersExecutive NEOs simultaneously participate in the 2015 Cash Plan and the 2013 Equity Plan,SICP, which provide the Compensation Committee with the ability to utilizeprovides multiple performance criteria at any given time. The Compensation Committee also has discretion and the ability to reduceadjust awards based on the named executive officer’san NEO's individual performance.
Several other features of the cash incentive award process further mitigate risk-taking and exposure, including the following: (i) financial results for the respective award period are reviewed by the Audit Committee prior to the issuance of any cash incentive award; (ii) the target for the cash incentive award is set at an amount that approximates the median cash incentive award of an industry peer group; and (iii) each cash incentive award features a cap (a maximum of 200% of the target) on the maximum amount that can be earned for any performance period.period, as well as an absolute dollar limit set under the terms of the 2015 Cash Plan.
The equity incentive awards compensate named executive officersExecutive NEOs for improving stockholder value by achieving growth in total shareholder returnTSR as well as growth in earnings, while investing for future long-term earnings growth. The Compensation Committee believes that these awards do not encourage unnecessary risk-taking since part of the ultimate value of the award is tied to the Company’s stock price and awards are staggered and cover a multi-year performance period. Additionally, several other features of the equity incentive award process further minimizeminimizes potential risk: (i) financial results for the respective award year are reviewed by the Audit Committee prior to the issuance of any equity incentive award; (ii) the total shareholder return and growth in long-term earningsall three performance metrics over the relevant performance periods are benchmarked against the same measures for a peer group of natural gas distribution companies, and the average return on equityROE performance component is compared to pre-determined return on equityROE thresholds that are established by the Compensation Committee; and (iii) each equity incentive award features a cap (a maximum of 150% or 200% of the target) on the maximum amount that can be earned in any year.year, as well as an absolute total share award limit set under the terms of the SICP. The Compensation Committee believes that the 2015 Cash Plan and the 2013 Equity
The Compensation Committee has adopted additional practices to ensure diligent and prudent decision-making and review processes. The practices that are in place to manage and control risk include:
During its goal-setting process, the Compensation Committee considers prior years’years' performance relative to future expected performance to assess the reasonableness of the goals;
The 2015 Cash Plan and the 2013 Equity PlanSICP include both performance and profitability measures, thus balancing growth with value creation;
The Compensation Committee retains discretion in administering all awards and performance goals, and in determining performance achievement;
Each named executive officerExecutive NEO is subject to stock ownership guidelines commensurate with his or her position that require attaining and maintaining a specific stock ownership threshold, which stock, together with his or her equity awards, could lose significant value over time if the Company waswere exposed to inappropriate or unnecessary risks whichthat could affect ourthe Company's stock price; and
In December 2015 and December 2016,February 2019, FW Cook & Co. provided the Compensation Committee with a market analysis that compared the Company’s executive compensation againstwith market data for the Company’s peer group, as well as fromwith energy industry survey data. Target total direct compensation for the named executive officers is withinExecutive NEOs was, in aggregate, slightly below a competitive range (+/- 15%-15%) of the market median of the Company’s peer group. The Company reviewed its compensation programs applicable to all employees in conjunction with the risks that have beenwere identified and included in the Company’sCompany's Annual Report on Form 10-K and determined that these programs do not create risk that could result in a material adverse effect on the Company.
Stock Ownership and Retention Guidelines. The Corporate Governance Committee is responsible for the development, oversight, and monitoring of stock ownership guidelines. In November 2014, the Board amended the ownership guidelines upon the recommendation of the Corporate Governance Committee, replacing those guidelines adopted by the Board in 2006. The amended stock ownership guidelines include recommendations made by FW Cook. Since 2014, no changes have been made to the stock ownership guidelines for Executive NEOs.
the Executive NEOs with those of the Company's stockholders. The Chief Executive Officer's stock ownership requirement is five times base salary, and all other Executive NEOs are at three times base salary. The stock ownership requirements can be achieved through several means, including making purchases on the open market, making optional cash investments through our Dividend Reinvestment and Direct Stock Purchase Plan, and earning performance incentive shares awarded by the Compensation Committee upon completion of the relevant performance period. Once an Executive NEO attains his or her ownership requirement, he or she will remain in compliance with the ownership guidelines despite future changes in the stock price and base salary, as long as the Executive NEO continues to own shares equal to the number of shares owned at the time the ownership requirement is met.
CHESAPEAKE UTILITIES CORPORATION - 20172020 Proxy Statement - 38
Key Compensation Decisions
Base Salary. In February 2019, the Compensation Committee reviewed and discussed the market analysis that was prepared by FW Cook to assess the competitiveness of base salary levels. FW Cook's market assessment compared the Company's base salaries for the Executive NEOs against market data for the Company's peer group, as well as from industry published survey data. FW Cook concluded that base salaries, in aggregate, for the Executive NEOs are slightly below a competitive range of the market median for the Company's peer group. Various factors such as experience, depth of responsibility, tenure, internal equity, and performance may drive variances to market. The Compensation Committee considered the following prior to setting base salaries for 2019: results of the market assessment performed by FW Cook; functional role of the position; scope of the individual’s responsibilities; prior year’s performance; internal equity and competitive nature of our business. For 2019, base salaries for the NEOs increased over their respective base salaries for the prior year.
Cash Incentive Award for the 2019 Performance Period. For 2019, the Compensation Committee granted cash incentive awards to each NEO under the 2015 Cash Plan. Generally, the target cash incentive award opportunity for each NEO is set at an amount that approximates the median prevailing practices of the industry peer group and broader energy industry for comparable positions. The actual award earned for all NEOs can range from 0% to 200% of the target cash incentive award, depending on actual performance at the end of the performance period as compared to the performance targets. The Compensation Committee may also use its discretion to adjust a participant’s cash incentive payout amount based on unanticipated and/or extraordinary events or other individual performance considerations. In general, the Compensation Committee’s discretion under the Cash Plan to adjust final bonus awards to NEO’s who are subject to the $1 million deduction limit under the Internal Revenue Code is limited to making a downward adjustment in the final amount payable.
In February 2019, the Compensation Committee established financial and non-financial performance targets for the NEOs. The EPS financial target for the NEOs was established at $3.80. Additionally, for Messrs. Thompson and Webber, the Committee established an aggregate pre-established business unit operating income target of $63,078,948 and $42,070,836, respectively. The payout opportunity for the EPS target and the business unit operating income target were 0% to 200% based upon a band centered around the applicable financial target. Each NEO also had established individual goals in connection with determining the extent to which the individual met his or her non-financial targets, including: (i) Organizational Effectiveness, (ii) Organizational Culture, and (iii) Environmental, Social and Governance Focus. The NEOs may earn a cash incentive award upon achieving his or her pre-established financial and non-financial targets based on the Compensation Committee’s evaluation. The Compensation Committee reserves the right to consider additional performance criteria for the Chief Executive Officer related to pursuing strategic or operational opportunities.
The following table shows each Executive NEO's target cash incentive award, based on his or her applicable base salary as of December 31, 2019 and weighting for the financial and non-financial performance targets. In February 2020, the Compensation Committee reviewed the Company's earnings and the extent to which each NEO had achieved his or her applicable performance goals. Based on this review, the Compensation Committee authorized the payment of cash incentive awards as reflected in the table below. The payout for the performance-based cash incentive awards ranged from 135% to 153% of each NEO’s target opportunity:
| 2019 CASH INCENTIVE AWARD | |||||||||||||||||||||||||||
Executive NEO(1) | Base Salary (at 12/31/2019) | Cash Opportunity (% of Base Salary) | Award at Target (100%) | Weighting for the Performance Targets | Actual Achievement of Performance Targets and Associated Payout | Payout reflected in Summary Compensation Table | |||||||||||||||||||||
| Non-Financial | Financial | Non- Financial | Financial | ||||||||||||||||||||||||
| Jeffry M. Householder | $ | 600,000 | 60% | $ | 360,000 | 20% | 80% | 153% | $ | 110,250 | 153% | $ | 441,000 | $ | 551,250 | ||||||||||||
James F. Moriarty(2) | $ | 385,000 | 45% | $ | 173,250 | 20% | 80% | 153% | $ | 53,058 | 153% | $ | 212,231 | $ | 265,289 | ||||||||||||
| Beth W. Cooper | $ | 385,000 | 45% | $ | 173,250 | 20% | 80% | 153% | $ | 53,058 | 153% | $ | 212,231 | $ | 265,289 | ||||||||||||
| Kevin J. Webber | $ | 275,000 | 35% | $ | 96,250 | 20% | 80% | 153% | $ | 29,477 | 134% | $ | 103,192 | $ | 132,669 | ||||||||||||
1 | Mr. Thompson was not included in this table because he retired effective December 31, 2019. As of his retirement, Mr. Thompson had a target award valued at $124,250 which is 35% of his base salary of $355,000. Mr. Thompson's weightings for the performance targets was 20% for the non-financial component and 80% for the financial component. For the non-financial component, Mr. Thompson achieved 100% of the performance target and received $24,850 as the associated payout. For the financial component, Mr. Thompson achieved 144% of the performance target and received $143,413 as the associated payout. The actual cash incentive payout amount for Mr. Thompson is reflected in the Non-Equity Incentive Plan Compensation column of the Summary Compensation Table. |
2 | In February 2017, Mr. Moriarty received a $305,000 time-vested cash award granted to him pursuant to the 2015 Cash Plan in connection with his promotion. The award vested in two equal amounts of $152,500 in February 2018 and February 2019 and is included in the applicable row in the Summary Compensation Table. |
Equity Incentive Awards. The Compensation Committee is authorized to grant equity incentive awards to NEOs under the SICP. While the SICP authorizes the issuance of several types of equity or equity-based awards, the Company’s long-term incentive awards to NEOs have historically been 100% performance-based, featuring annual grants of shares that are awarded if pre-established performance targets
CHESAPEAKE UTILITIES CORPORATION - 2020 Proxy Statement - 39
are achieved at the end of a three-year performance period. The equity incentive awards are designed to reward executives for improving stockholder value by achieving growth in earnings while investing in the future growth of our businesses. The target equity award is a number of shares equivalent to the dollar value based on a percentage of base salary. The payout opportunity is 0% (minimum), 50% (threshold), 100% (target) and 200% (maximum) of the target equity award and as reflected in the table for the ROE component. The actual award earned for each NEO can range from zero to the maximum payout opportunity of 200% of the target number of shares, depending on actual performance at the end of the performance period (a three year or transition performance period) as compared to the performance targets. Awards are granted for each performance period pursuant and subject to the terms of performance share agreements entered into by each NEO and the Company.
2019 Equity Incentive Awards.In February 2019, the Compensation Committee granted performance-based equity incentive awards to each Executive NEO for the January 1, 2019 through December 31, 2021 performance period as follows:
| EQUITY INCENTIVE AWARD OPPORTUNITY FOR THE 2019-2021 PERFORMANCE PERIOD | |||||||||||||||||
Executive NEO(1) | Base Salary (at 2/25/2019) | Opportunity (% of Base Salary) | Target Equity Value | Average Closing Stock Price | Target Equity Shares | ||||||||||||
| Jeffry M. Householder | $ | 600,000 | 100% | $ | 600,000 | $ | 84.01 | 7,142 | |||||||||
| James F. Moriarty | $ | 385,000 | 75% | $ | 288,750 | $ | 84.01 | 3,437 | |||||||||
| Beth W. Cooper | $ | 385,000 | 75% | $ | 288,750 | $ | 84.01 | 3,437 | |||||||||
| Kevin J. Webber | $ | 275,000 | 65% | $ | 178,750 | $ | 84.01 | 2,128 | |||||||||
1 | On February 25, 2019, the Compensation Committee granted awards to Mr. Thompson under the 2019 Equity Incentive Plan. The award was based on 65% of Mr. Thompson's base salary of $355,000, resulting in a target equity value of $230,750 (or 2,747 shares based on an average closing stock price of $84.01). Mr. Thompson retired effective December 31, 2019 and is eligible for a prorata portion of his target shares (33%) at the end of the 2019-2021 performance period depending on the extent to which performance targets were achieved during his service with the Company. |
The Compensation Committee approved the following performance components in connection with the equity incentive awards granted for the 2019-2021 Performance period.
| Performance Component | Benchmark and Description of Benchmark | % of Target Award |
| TSR | Total shareholder return compared to the total shareholder returns of companies included in the peer group for the performance period. Shareholder Return incentivizes executives to generate additional value for our stockholders. | 30% |
| Growth in Long-Term Earnings | Total capital expenditures as a percentage of total capitalization as compared to companies in the peer group for the performance period. In the long-term, the Company’s growth in earnings per share is dependent upon continuous investment of capital at levels sufficient to drive growth. | 35% |
| ROE | Average ROE compared to pre-determined ROE targets and the ROE relative to peer group performance. ROE measures the Company’s ability to generate current income using equity investors’ capital. | 35% |
The Compensation Committee evaluates achievement of the TSR and Growth in Long-Term Earnings performance components based upon evaluating the Company's performance relative to the performance of a peer group over the applicable thirty-six month performance period. The Company's performance is ranked against the performance of the peer group. The payout opportunity is based on the Company's percentile ranking against the companies in the peer group for each of these two performance components as shown in the table below.
| Percentile Ranking as Compared To Companies in the Performance Peer Group | Percentage of Payout of Target Equity Incentive Award | |
| 40th – 49th percentile | 50% | |
| 50th – 54th percentile | 75% | |
| 55th – 59th percentile | 100% | |
| 60th – 64th percentile | 125% | |
| 65th – 69th percentile | 150% | |
| 70th – 80th percentile | 175% | |
| Greater than 80th percentile | 200% | |
CHESAPEAKE UTILITIES CORPORATION - 2020 Proxy Statement - 40
The Compensation Committee evaluates achievement of the ROE component based on the matrix provided below. NEOs are evaluated based both on the Company's average ROE over the three-year performance period as compared to pre-determined ROE thresholds of 10% to a maximum of 12% and the ROE relative to the ROE performance of the peer group.
| Percentile Rank | Payout Matrix | ||||
| Maximum | 75% | 75% | 100% | 175% | 200% |
| Target | 50% | 50% | 75% | 100% | 150% |
| Threshold | 25% | 25% | 50% | 75% | 100% |
| Threshold | Low Target | Target | Maximum | ||
| 10.00% | 11.00% | 11.25% | 12.00% | ||
| 3 YEAR AVERAGE ROE COMPARED TO FIXED TARGETS | |||||
The peer group used to evaluate these components is provided in the performance share agreement applicable to these awards filed as Exhibit 10.19 of our Annual Report on Form 10-K for the period ended December 31, 2019. The payout opportunity for the 2019 Equity Incentive Awards is 0% (minimum), 50% (threshold), 100% (target), and 200% (maximum) of the target equity award and as reflected in the table above for the ROE component.
2019-2020 Transitional Equity Incentive Awards.On December 4, 2019, the Board, upon recommendation from the Compensation Committee, approved transitional equity incentive awards for the Executive NEOs in connection with their increased responsibilities in 2019. Executive NEOs were granted a transitional performance-based target equity incentive award for the January 1, 2019 through December 31, 2020 performance period as follows: Householder - 4,064 shares; Moriarty - 768 shares; Cooper - 697 shares; and Webber 1,284 shares. The incentive opportunity as a percentage of base salary is 65% for Messrs. Householder and Moriarty and Ms. Cooper and 25% for Mr. Webber. The features of these awards are similar to the features described above for the 2019 Equity Incentive Awards. The peer group used to evaluate these components is provided in the performance share agreement applicable to these awards filed as Exhibit 10.25 of our Annual Report on Form 10-K for the period ended December 31, 2019. The payout opportunity is 0% (minimum), 50% (threshold), 100% (target), and 200% (maximum) of the target equity award and as reflected in the table above for the ROE component for the 2019 Equity Incentive Awards. Each Executive NEO is entitled to earn the performance shares at the end of the performance period depending on the extent to which performance targets are achieved. The Compensation Committee will determine the achievement of equity incentive grants made to the Executive NEOs for the 2019-2020 Transitional Equity Incentive Award upon consideration of pre-established performance targets for the 2019-2020 performance period.
2019-2021 Transitional Equity Incentive Awards.On December 4, 2019, the Board of Directors, upon recommendation from the Compensation Committee, approved transitional equity incentive awards for the Executive NEOs in connection with their increased responsibilities in 2019. Executive NEOs were granted a transitional performance-based target equity incentive award for the January 1, 2019 through December 31, 2021 performance period as follows: Householder - 4,064 shares; Moriarty - 768 shares; Cooper - 697 shares; and Webber 1,284 shares. The incentive opportunity as a percentage of base salary is 65% for Messrs. Householder and Moriarty and Ms. Cooper and 25% for Mr. Webber. The features of these awards are similar to the features described above for the 2019 Equity Incentive Awards. The peer group used to evaluate these components is provided in the performance share agreement applicable to these awards filed as Exhibit 10.26 of our Annual Report on Form 10-K for the period ended December 31, 2019. The payout opportunity is 0% (minimum), 50% (threshold), 100% (target), and 200% (maximum) of the target equity award and as reflected in the table above for the ROE component for the 2019 Equity Incentive Awards. Each Executive NEO is entitled to earn the performance shares at the end of the performance period depending on the extent to which performance targets are achieved. The Compensation Committee will determine the achievement of equity incentive grants made to the Executive NEOs for the 2019-2021 Transitional Equity Incentive Award upon consideration of pre-established performance targets for the 2019-2021 performance period.
2018Equity Incentive Awards.In February 2018, the Compensation Committee granted performance-based target equity incentive awards to several NEOs for the January 1, 2018 through December 31, 2020 performance period as follows: Householder - 2,769 shares, Moriarty - 2,689 shares and Cooper - 2,769 shares. The incentive opportunity as a percentage of base salary is 65% for each of the executives. The features of these awards are similar to the features described above for the 2019 Equity Incentive Awards. The peer group used to evaluate these components is provided in the performance share agreement applicable to these awards filed as Exhibit10.1 of our Quarterly Report on Form 10-Q for the period ended March 31, 2018. The payout opportunity is 0% (minimum), 50% (threshold), 100% (target), and 200% (maximum) of the target equity award and as reflected in the table above for the ROE component. Each Executive NEO is entitled to earn the performance shares at the end of the performance period depending on the extent to which performance targets are achieved. Mr. Webber's incentive award for the 2018-2020 performance period was established by the Chief Executive Officer and is a long-term cash incentive award. The award is based on 25% of Mr. Webber's base salary of $275,000, resulting in a target value of $68,750. The payout opportunity for Mr. Webber is 0% (minimum), 50% (threshold), 100% (target), and 150% (maximum). Mr. Webber's award is based on the following performance components and weighting: TSR (30%), Growth in Long-Term Earnings for our Florida businesses and for the Company on a consolidated basis (35%), and ROE for our Florida businesses and for the Company on a consolidated basis (35%). In February 2018, the Compensation Committee granted awards to Mr. Thompson under the 2018 Equity Incentive Plan with a target equity award of 2,809 shares having the same weightings and performance metrics as Messrs. Householder and Moriarty and Ms. Cooper. Mr. Thompson retired effective December 31, 2019 and is eligible for a prorata portion of his target shares (66%) at the end of the performance period depending on the extent to which performance targets were achieved during his service with the Company.
CHESAPEAKE UTILITIES CORPORATION - 2020 Proxy Statement - 41
The Compensation Committee will determine the achievement of equity incentive grants made to the NEOs for the 2018 Equity Incentive Award upon consideration of pre-established performance targets for the 2018-2020 performance period.
2017Equity Incentive Award. In February 2017, the Compensation Committee granted performance-based target equity incentive awards to several NEOs for the January 1, 2017 through December 31, 2019 performance period as follows: Householder - 2,943 shares, Moriarty - 2,805 shares, Cooper - 2,943 shares and Thompson - 3,173 shares. The features of these awards are similar to the features described above for the 2019 Equity Incentive Awards. The peer group used to evaluate these components is provided in the performance share agreement applicable to these awards filed as Exhibit 10.1 of our Quarterly Report on Form 10-Q for the period ended June 30, 2017. The payout opportunity is 0% (minimum), 50% (threshold), 100% (target), and 200% (maximum) of the target equity award for each executive. Each executive is entitled to earn the performance shares at the end of the performance period depending on the extent to which performance targets are achieved. Mr. Webber's incentive award for the 2017-2019 performance period was established by the Chief Executive Officer and is a long-term cash incentive award. The award is based on 25% of Mr. Webber's base salary of $275,000, resulting in a target value of $68,750. The payout opportunity for Mr. Webber is 0% (minimum), 50% (threshold), 100% (target), and 150% (maximum). Mr. Webber's award is based on the following performance components and weights: TSR (30%), Growth in Long-Term Earnings for our Florida businesses and for the Company on a consolidated basis (35%), and ROE for our Florida businesses and for the Company on a consolidated basis (35%). Mr. Webber's actual payout for the 2017-2019 performance period was $91,093.
The Compensation Committee met in February 2020 to review the extent to which Messrs. Householder, Moriarty and Ms. Cooper, as well as Mr. Thompson achieved the performance targets established for the 2017 Equity Incentive Awards. During this performance period: (i) with respect to the TSR component, our TSR for the three years ended December 31, 2019, was at the 67th percentile compared to the peer companies’ TSR for the same period and (ii) with respect to the Growth in Long-Term Earnings component, total capital expenditures as a percentage of total capitalization for the Company was at the 100th percentile of our peer group. For the purposes of calculating the Earnings Performance component, the average ROE for the three years ended December 31, 2019 for the Company was 11.23%, which represented the 91.5th percentile. The executives received a payout of 150% of the target for the TSR, 200% of the target for the Growth in Long-Term Earnings components, and a payout of 169% of the target for the ROE component. The shares received by each executive for the 2017 Equity Incentive Award are reflected in the table below. In addition, dividends on the equity incentive awards accrue in the form of dividend equivalents during the performance period and are paid to the respective executive in proportion to the actual shares earned.
| ACHIEVEMENT OF 2017 EQUITY INCENTIVE AWARD FOR THE 2017 - 2019 PERFORMANCE PERIOD | ||||||||
Executive NEO(1)(2) | Target Shares | TSR (30% Weighting) | Growth in Long-Term Earnings (35% Weighting) | ROE (35% Weighting) | Actual Payout | |||
| Jeffry M. Householder | 2,943 | 1,324 | 2,060 | 1,741 | 5,125 | |||
| James F. Moriarty | 2,805 | 1,262 | 1,964 | 1,659 | 4,885 | |||
| Beth W. Cooper | 2,943 | 1,324 | 2,060 | 1,741 | 5,125 | |||
1 | Mr. Thompson was not included in this table because he retired effective December 31, 2019. In February 2017, the Compensation Committee granted awards to Mr. Thompson under the 2017 Equity Incentive Plan with a target equity award of 3,173 shares having the same weightings and performance metrics as Messrs. Householder, Moriarty and Ms. Cooper. Mr. Thompson's actual payout for the 2017-2019 performance period was 5,526 shares. |
2 | Mr. Webber'sincentive award for the 2017-2019 performance period was established by the Chief Executive Officer and is a long-term cash incentive award. The award is based on 25% of Mr. Webber’s base salary of $275,000, resulting in a target value of $68,750. The payout opportunity for Mr. Webber is 0% (minimum), 50% (threshold), 100% (target), and 150% (maximum). Mr. Webber’s award is based on the following performance components and weights: TSR (30%), Growth in Long-Term Earnings for our Florida businesses and for the Company on a consolidated basis (35%), and ROE for our Florida businesses and for the Company on a consolidated basis (35%). Mr. Webber's actual payout for the 2017-2019 performance period was $91,093. |
Stock Vested During 2019
In February 2020, the Compensation Committee met and approved 2017 Equity Incentive Awards for Messrs. Householder and Moriarty and Ms. Cooper, as well as Mr. Thompson, described above in the 2017 Equity Incentive Award section in this Proxy Statement. These equity incentive awards vested in 2019.
| STOCK VESTED DURING 2019 | |||||||||||||||
Executive NEO(1)(2) | Date Shares Awarded by Compensation Committee | Number of Shares Acquired on Vesting(3) | Stock Price | Value Realized on Vesting | |||||||||||
| Jeffry M. Householder | 2/25/2020 | 5,125 | $ | 94.64 | $ | 485,030 | |||||||||
| James F. Moriarty | 2/25/2020 | 4,885 | $ | 94.64 | $ | 462,316 | |||||||||
| Beth W. Cooper | 2/25/2020 | 5,125 | $ | 94.64 | $ | 485,030 | |||||||||
1Mr. Thompson was not included in this table because he retired effective December 31, 2019. For performance under the 2017 Equity Incentive Plan, Mr. Thompson acquired 5,526 shares of common stock valued at $522,980 based upon a price per share of $94.64.
2Mr. Webber received a long-term cash incentive award for the 2017-2019 performance period.
3The shares awarded and corresponding value realized, reflect shares received in March 2020 by the executives in the table above for the three-year performance period ended December 31, 2019.
CHESAPEAKE UTILITIES CORPORATION - 2020 Proxy Statement - 42
In February 2018, the Compensation Committee granted performance shares to Messrs. Householder and Moriarty and Ms. Cooper, as well as Mr. Thompson, for the 2018-2020 performance period. In February 2019, the Compensation Committee granted performance shares to the NEOs for the 2019-2021 performance period. In December 2019, the Compensation Committee also granted transitional equity incentive awards to the Executive NEOs in connection with their increased responsibilities in 2019 for the 2019-2020 and 2019-2021 performance periods. The values of the 2018 Equity Incentive Awards are reflected in the Stock Award column for 2018 in the Summary Compensation Table and are further described under the 2018 Equity Incentive Awards section in this Proxy Statement. The values of the 2019 Equity Incentive Awards, 2019-2020 Transitional Awards, and 2019-2021 Transitional Awards are reflected in the Stock Award column for 2019 in the Summary Compensation Table and in the Grant Date Fair Value column in the Grants of Plan-Based Awards Table. Please refer to the 2019 Equity Incentive Awards and Grants of Plan-Based Awards sections in this Proxy Statement for additional details on these awards.
Executive Compensation
Summary Compensation Table
The following table provides information on compensation earned by the NEOs for the years ended December 31, 2016, 20152019, 2018 and 2014 by the Chief Executive Officer, Chief Financial Officer, and three additional most highly compensated executive officers employed by the Company at year-end (collectively, the “named executive officers”).2017. In determining the individuals to be included in this table, we considered the roles and responsibilities forof individuals serving at the Company and its subsidiaries during 2019, as well as total compensation (reduced by the change in pension value and nonqualifiednon-qualified deferred compensation earnings), for all officers of the Company for the year ended December 31, 2016.2019.
| 2016 Summary Compensation Table | ||||||||||||||
Name and Principal Position | Year | Salary | Stock Awards | Bonus | Non-Equity Incentive Plan Compensation | Change in Pension Value and Non-Qualified Deferred Compensation Earnings | All Other Compensation | Total | ||||||
| ($) | ($)1 | ($)2 | ($)3 | ($)4,5 | ($)6 | ($) | ||||||||
Michael P. McMasters7 Chief Executive Officer, President, and Director | 2016 | 572,500 | 730,840 | — | 330,600 | 64,469 | 72,964 | 1,771,373 | ||||||
| 2015 | 531,250 | 477,424 | — | 617,100 | 23,456 | 80,247 | 1,729,477 | |||||||
| 2014 | 466,250 | 443,867 | — | 339,739 | 107,742 | 111,778 | 1,469,376 | |||||||
Stephen C. Thompson Senior Vice President | 2016 | 338,750 | 285,616 | — | 148,920 | 57,571 | 48,566 | 879,423 | ||||||
| 2015 | 333,750 | 221,123 | — | 186,930 | 3,310 | 52,153 | 797,266 | |||||||
| 2014 | 327,500 | 215,208 | — | 136,470 | 145,742 | 66,086 | 891,006 | |||||||
Beth W. Cooper Senior Vice President and Chief Financial Officer | 2016 | 308,000 | 260,414 | — | 86,490 | 14,727 | 51,785 | 721,416 | ||||||
| 2015 | 300,625 | 198,675 | — | 169,422 | 2,444 | 49,345 | 720,511 | |||||||
| 2014 | 293,625 | 191,670 | — | 127,062 | 31,620 | 53,590 | 697,567 | |||||||
Elaine B. Bittner Senior Vice President | 2016 | 297,500 | 256,214 | — | 70,913 | — | 41,318 | 665,945 | ||||||
| 2015 | 271,250 | 174,218 | — | 156,750 | — | 36,334 | 638,552 | |||||||
| 2014 | 253,750 | 158,043 | — | 113,101 | — | 46,324 | 571,218 | |||||||
Jeffry M. Householder President of Florida Public Utilities Company | 2016 | 302,308 | 256,214 | — | 86,011 | — | 34,701 | 679,234 | ||||||
| 2015 | 291,500 | 188,959 | 50,000 | 112,838 | — | 26,571 | 669,868 | |||||||
| 2014 | 279,711 | 183,936 | 30,000 | 69,144 | — | 49,920 | 612,711 | |||||||
| 2019 SUMMARY COMPENSATION TABLE | Change in Pension Value and NQDC Earnings(5)(6) | |||||||||||||||||||||||||
NEO and Principal Position | Year | Salary | Stock Awards(1),(2) | Bonus(3) | Non-Equity Incentive Plan Compensation(4) | All Other Compensation(7) | Total | |||||||||||||||||||
Jeffry M. Householder(8) Chief Executive Officer and President | 2019 | $ | 614,596 | $ | 2,115,485 | $ | — | $ | 551,250 | $ | — | 59,680 | $ | 3,341,011 | ||||||||||||
| 2018 | $ | 338,269 | $ | 251,872 | $ | — | $ | 169,095 | $ | — | $ | 33,538 | $ | 792,774 | ||||||||||||
| 2017 | $ | 315,962 | $ | 264,670 | $ | 15,000 | $ | 61,824 | $ | — | $ | 61,803 | $ | 719,259 | ||||||||||||
James F. Moriarty Executive Vice President, General Counsel, Corporate Secretary and Chief Policy and Risk Officer | 2019 | $ | 377,244 | $ | 663,322 | $ | 20,000 | $ | 417,789 | $ | — | 58,115 | $ | 1,536,470 | ||||||||||||
| 2018 | $ | 327,500 | $ | 244,595 | $ | — | $ | 314,975 | $ | — | 25,152 | $ | 912,222 | |||||||||||||
Beth W. Cooper Executive Vice President, Chief Financial Officer and Assistant Secretary | 2019 | $ | 378,795 | $ | 642,118 | $ | 50,000 | $ | 265,289 | $ | 54,508 | 47,742 | $ | 1,438,452 | ||||||||||||
| 2018 | $ | 338,750 | $ | 251,872 | $ | — | $ | 167,325 | $ | — | $ | 44,292 | $ | 802,239 | ||||||||||||
| 2017 | $ | 317,500 | $ | 264,670 | $ | 25,000 | $ | 35,520 | $ | 31,032 | $ | 69,981 | $ | 743,703 | ||||||||||||
Kevin J. Webber Senior Vice President | 2019 | $ | 278,865 | $ | 652,155 | $ | 20,000 | $ | 132,669 | $ | — | 33,541 | $ | 1,117,230 | ||||||||||||
Stephen C. Thompson Retired Senior Vice President | 2019 | $ | 353,750 | $ | 346,835 | $ | — | $ | 168,263 | $ | 174,391 | 52,530 | $ | 1,095,769 | ||||||||||||
| 2018 | $ | 348,750 | $ | 255,511 | $ | — | $ | 183,016 | $ | — | $ | 47,518 | $ | 834,795 | ||||||||||||
| 2017 | $ | 343,750 | $ | 285,348 | $ | 15,000 | $ | 73,278 | $ | 114,554 | $ | 77,254 | $ | 909,184 | ||||||||||||
1 | Executive NEOs received an equity incentive award for the 2019-2021 performance period as follows: Householder - $901,745; Moriarty - $433,954; Cooper - $433,954; Webber - $268,680; Thompson - $346,835. On December 4, 2019 the Board of Directors, upon recommendation from the Compensation Committee, approved transitional equity incentive awards for Messrs. Householder, Moriarty and Webber, and Ms. Cooper in connection with their increased responsibilities in 2019. Executive NEOs received a transitional equity incentive award for the 2019-2021 performance period as follows: Householder - $603,866; Moriarty - $114,116; Cooper - $103,567; and Webber - $190,788. Executive NEOs received a transitional equity incentive award for the 2019-2020 performance period as follows: Householder - $609,874; Moriarty - $115,252; Cooper - $104,597; and Webber - $192,687. The features of these awards are described under the Transitional Equity Incentive Awards Sections in this Proxy Statement. |
2 | For |
CHESAPEAKE UTILITIES CORPORATION - 2020 Proxy Statement - 43
| Estimated Payout for Performance-Based Equity Incentive Awards | Estimated Payout for Market-Based Equity Incentive Awards | ||||||||||||||||
| Year | Performance Period | Grant Date | Growth in Long-Term Earnings | Earnings Performance | Fair Value Per Share | Shareholder Return | Monte Carlo Estimated Percentile Ranking | Fair Value Per Share | |||||||||
| 2016 | 2016-2018 | 2/22/2016 | 150% | 100% | $ | 64.00 | 150% | 65% | $ | 76.98 | |||||||
| 2015 | 2015-2017 | 1/13/2015 | 150% | 100% | $ | 50.20 | 150% | 65% | $ | 43.55 | |||||||
| 2014 | 2014-2016 | 1/7/2014 | 150% | 100% | $ | 39.97 | 150% | 65% | $ | 36.53 | |||||||
| ESTIMATED PAYOUT FOR EQUITY INCENTIVE AWARDS | ||||||||||||||||
| Performance-Based Equity Awards | Market-Based Equity Awards | |||||||||||||||
| Year | Performance Period | Grant Date | Growth in Long-Term Earnings | ROE | Fair Value Per Share | TSR | Monte Carlo Estimated Percentile Ranking | Fair Value Per Share | ||||||||
| 2019 | 2019-2021 | 2/25/2019 | 200% | 100% | $ | 91.19 | 100% | 53% | $ | 101.70 | ||||||
| 2019 | 2019-2021 | 12/3/2019 | 200% | 178% | $ | 91.48 | 100% | 51% | $ | 91.87 | ||||||
| 2019 | 2019-2020 | 12/3/2019 | 200% | 186% | $ | 91.48 | 100% | 52% | $ | 88.26 | ||||||
| 2018 | 2018-2020 | 2/26/2018 | 200% | 100% | $ | 68.85 | 100% | 43% | $ | 62.23 | ||||||
| 2017 | 2017-2019 | 2/23/2017 | 200% | 100% | $ | 67.40 | 100% | 65% | $ | 63.83 | ||||||
If the named executive officersmaximum awards were to achieve the maximum awardachieved for the 2016-2018NEOs for the 2019-2021 performance period as reflected in the 2019 row of the Summary Compensation Table, each award would be valued as follows: Mr. McMasters $1,094,862; Mr.Householder - $1,347,595, Moriarty - $648,514, Cooper - $648,514, Webber - $401,524, and Thompson $427,877; Ms. Cooper $390,123; Ms. Bittner $383,831; and Mr. Householder $383,831.- $518,320. If the named executive officersmaximum transitional awards were to achieve the maximum awardachieved for the 2015-2017Executive NEOs for the 2019-2021 performance period as reflected in the 2019 row of the Summary Compensation Table, each award would be valued as follows: Mr. McMasters $543,450; Mr.Householder - $744,500, Moriarty - $140,693, Cooper - $127,686 and Webber - $235,221. If the maximum transitional awards were achieved for the Executive NEOs for the 2019-2020 performance period as reflected in the 2019 row of the Summary Compensation Table, each award would be valued as follows: Householder - $735,698, Moriarty - $139,030, Cooper - $126,177 and Webber - $232,440. If the maximum awards were achieved for the following executives for the 2018-2020 performance period as reflected in the 2018 row of the Summary Compensation Table, each award would be valued as follows: Householder - $370,293, Moriarty - $359,595, Cooper - $370,293, and Thompson $251,703; Ms.- $375,642. If the maximum awards were achieved for the following executives for the 2017-2019 performance period as reflected in the 2017 row of the Summary Compensation Table, each award would be valued as follows: Householder - $390,470, Cooper $226,152; Ms. Bittner $198,312;- $390,470 and Mr. Householder $215,092.
$420,975.
3 |
4 |
5 | The two defined benefit pension plans (a qualified plan, the Pension Plan, and a non-qualified plan, the Pension SERP) were frozen as of |
The assumptions used to calculate the present value of the Pension SERP are the same as those used for the Pension Plan, except that there is no assumed return on assets because the Pension SERP is unfunded. Variances from year to year have the same causes as the Pension Plan. Additionally, Mr. McMasters has elected to receive his Pension SERP benefit in a lump sum payment upon retirement and Mr. Thompson elected to receive his Pension SERP benefit in annuity payments upon retirement. These elections also impact the present value calculation due to assumptions regarding the IRS lump sum interest rates. In 2016, theat age 65. The present value of Mr. McMasters’Thompson's Pension SERP accumulated benefit increased in 2019 and 2017 by $3,265$39,286 and Mr. Thompson’s Pension SERP increased$14,170, respectively and decreased in 2018 by $4,337. In 2015, the present value of Mr. McMasters’ Pension SERP increased by $12,974 and Mr. Thompson’s Pension SERP decreased by $5,283. In 2014, the present value of Mr. McMasters and Mr. Thompson‘s Pension SERP increased by $3,922 and $48,803, respectively. Ms. Cooper, Ms. Bittner and Mr. Householder do not participate$10,169. No other NEO participates in the Pension SERP.
6 | Dividends on deferred stock units (which are settled on a one-for-one basis in shares of common stock) are the same as dividends paid on the Company’s outstanding shares of common stock. For |
7 | The following table includes payments that were made by the Company on behalf of the NEOs in 2017, 2018 and 2019. |
| Named Executive Officer | Qualified and Nonqualified Retirement Plan Matching and Supplemental Contributions ($) | Term Life Insurance Premiums ($) | Vehicle Allowance ($) | Dividends on shares earned for the 2014-2016 Performance Period ($) | |||||||||||||||
| 2014 | 2015 | 2016 | 2014 | 2015 | 2016 | 2014 | 2015 | 2016 | 2014 | ||||||||||
| Michael P. McMasters | 56,960 | 73,106 | 64,398 | 480 | 480 | 480 | 10,283 | 6,661 | 8,086 | 44,055 | |||||||||
| Stephen C. Thompson | 37,376 | 44,146 | 41,351 | 480 | 480 | 480 | 6,867 | 7,527 | 6,735 | 21,363 | |||||||||
| Beth W. Cooper | 24,833 | 39,938 | 42,017 | 480 | 480 | 480 | 9,248 | 8,927 | 9,288 | 19,029 | |||||||||
| Elaine B. Bittner | 26,520 | 34,872 | 39,093 | 472 | 480 | 480 | 3,640 | 982 | 1,745 | 15,692 | |||||||||
| Jeffry M. Householder | 36,918 | 25,431 | 31,994 | 480 | 480 | 480 | 657 | 660 | 2,227 | 11,865 | |||||||||
| NEO | Qualified and Non-Qualified 401(k) Plan Matching and Supplemental Contributions | Term Life Insurance Premiums | Vehicle Allowance | Dividends on shares earned for the 2017-2019 Performance Period | |||||||||||||||||||||||||||
| 2017 | 2018 | 2019 | 2017 | 2018 | 2019 | 2017 | 2018 | 2019 | 2017 | ||||||||||||||||||||||
| Jeffry M. Householder | $ | 37,058 | $ | 30,632 | $ | 56,221 | $ | 480 | $ | 480 | $ | 520 | $ | 2,227 | $ | 2,426 | $ | 2,939 | $22,038 | ||||||||||||
| James F. Moriarty | n/a | $ | 20,810 | $ | 53,016 | n/a | $ | 480 | $ | 480 | n/a | $ | 3,862 | $ | 4,619 | $21,006 | |||||||||||||||
| Beth W. Cooper | $ | 38,781 | $ | 36,431 | $ | 44,903 | $ | 480 | $ | 480 | $ | 480 | $ | 8,682 | $ | 7,381 | $ | 2,359 | $22,038 | ||||||||||||
| Kevin J. Webber | n/a | n/a | $ | 32,322 | n/a | n/a | $ | 477 | n/a | n/a | $ | 742 | n/a | ||||||||||||||||||
| Stephen C. Thompson | $ | 45,853 | $ | 40,255 | $ | 45,576 | $ | 480 | $ | 480 | $ | 480 | $ | 7,159 | $ | 6,783 | $ | 6,474 | $23,762 | ||||||||||||
IRS. The cash dividend amounts paid to Messrs. McMasters, Thompson and Householder and Mmes. Cooper and Bittnerthe NEOs in 20172020 for the 2014-20162017-2019 performance period are reflected in the 20142017 row in the Summary Compensation Table, the year the share awards (on which the dividends were based) were granted by the Compensation Committee. Dividends were accrued on the same basis as dividends declared by the Board each calendar quarter during the applicable years and paid on the Company’sCompany's common stock. The actual cash dividend received by each named executive officerNEO was determined based upon the number of shares of common stock earned and issued to the executive for such performance periods.
8 | Mr. |
CHESAPEAKE UTILITIES CORPORATION - 20172020 Proxy Statement - 44
Grants of Plan-Based Awards
The following table reflects, for each named executive officer,Executive NEO, the range of payouts for 2016cash incentive awards established by the Compensation Committee on February 25, 2019 relating to the 2019 performance under the 2015 Cash Incentive Plan,period, and reflects the number of equity incentive awards established by the Compensation Committee on February 22, 201625, 2019 for the 2016-20182019-2021 performance period. On December 3, 2019, the Compensation Committee also granted transitional equity incentive awards to the Executive NEOs in connection with their increased responsibilities in 2019 for the 2019-2020 and 2019-2021 performance periods. For each named executive officer,Executive NEO, the Compensation Committee established a target equity award with a dollar value (as a percentpercentage of base salary) to be paid in shares of our common stock, if earned, based on the grant date fair value of the common stock. The threshold (minimum amount payable for a certain level of performance), target (amount payable if the targets are reached), and maximum (maximum payout possible) award levels are provided for each award. Additional information on these awards can be found under the Cash Incentive Award and Equity Incentive Award sections in our Key Compensation Discussion and AnalysisDecisions section in this Proxy Statement.
| Grants of Plan-Based Awards | ||||||||||
| Plan | Grant Date / Date of Compensation Committee Action | Estimated Future Payouts Under Non-Equity Incentive Plan Awards | Estimated Future Payouts Under Equity Incentive Plan Awards | Grant Date Fair Value of Stock Awards1 | ||||||
| Threshold at 50% | Target at 100% | Maximum at 200% | Threshold at 50% | Target at 100% | Maximum at 200% | |||||
| Name | ($) | ($) | ($)2 | (#) | (#) | (#) | ($) | |||
| Michael P. McMasters | 2016 Cash Incentive Plan | 2/22/2016 | 174,000 | 348,000 | 696,000 | |||||
| 2016-2018 Equity Incentive Plan | 2/22/2016 | 4,032 | 8,063 | 16,126 | 730,840 | |||||
| Stephen C. Thompson | 2016 Cash Incentive Plan | 2/22/2016 | 51,000 | 102,000 | 204,000 | |||||
| 2016-2018 Equity Incentive Plan | 2/22/2016 | 1,576 | 3,151 | 6,302 | 285,616 | |||||
| Beth W. Cooper | 2016 Cash Incentive Plan | 2/22/2016 | 46,500 | 93,000 | 186,000 | |||||
| 2016-2018 Equity Incentive Plan | 2/22/2016 | 1,437 | 2,873 | 5,746 | 260,414 | |||||
| Elaine B. Bittner | 2016 Cash Incentive Plan | 2/22/2016 | 45,750 | 91,500 | 183,000 | |||||
| 2016-2018 Equity Incentive Plan | 2/22/2016 | 1,413 | 2,827 | 5,653 | 256,214 | |||||
| Jeffry M. Householder | 2016 Cash Incentive Plan | 2/22/2016 | 45,750 | 91,500 | 183,000 | |||||
| 2016-2018 Equity Incentive Plan | 2/22/2016 | 1,413 | 2,827 | 5,653 | 256,214 | |||||
| GRANTS OF PLAN-BASED AWARDS | ||||||||||||||||||
| 2019 Cash Incentive Plan | 2019-2021 Equity Incentive Plan | |||||||||||||||||
| Estimated Future Payouts Under Non-Equity Incentive Plan Awards | Estimated Future Payouts Under Equity Incentive Plan Awards | Grant Date Fair Value(2) | ||||||||||||||||
EXECUTIVE NEO(1) | Grant Date | Threshold 50% | Target 100% | Maximum 200% | Grant Date | Threshold 50% | Target 100% | Maximum 200% | ||||||||||
| Jeffry M. Householder | 2/25/2019 | $ | 180,000 | $ | 360,000 | $ | 720,000 | 2/25/2019 | 3,571 | 7,142 | 14,284 | $ | 901,745 | |||||
| James F. Moriarty | 2/25/2019 | $ | 86,625 | $ | 173,250 | $ | 346,500 | 2/25/2019 | 1,719 | 3,437 | 6,874 | $ | 433,954 | |||||
| Beth W. Cooper | 2/25/2019 | $ | 86,625 | $ | 173,250 | $ | 346,500 | 2/25/2019 | 1,719 | 3,437 | 6,874 | $ | 433,954 | |||||
| Kevin J. Webber | 2/25/2019 | $ | 48,125 | $ | 96,250 | $ | 192,500 | 2/25/2019 | 1,064 | 2,128 | 4,256 | $ | 268,680 | |||||
1 | Mr. Thompson was not included in this table because he retired effective December 31, 2019. On February 25, 2019, the Compensation Committee granted awards to Mr. Thompson under the 2019 Cash Incentive Award as follows: Threshold (50%) $62,125, Target (100%) $124,250, Maximum (200%) $248,500. The actual cash incentive payout amount for Mr. Thompson is reflected in the Non-Equity Incentive Plan Compensation column of the Summary Compensation Table. On February 25, 2019, the Compensation Committee granted an award to Mr. Thompson under the 2019-2021 Equity Incentive Plan as follows: Threshold (50%) 1,374 shares, Target (100%) 2,747 shares and Maximum (200%) 5,494 shares. The Grant Date Fair Value on February 25, 2019 at target was $346,835. The Compensation Committee will determine the achievement of equity incentive grants made to the NEOs for the 2019 Equity Incentive Award upon consideration of pre-established performance targets for the 2019-2021 performance period. |
2 | For the 2019-2021 performance period, we calculated the aggregate grant date fair value of the performance-based equity incentive awards based on the estimated compensation costs on the grant date. We estimated that 200% of the Growth in Long-Term Earnings component and 100% of the ROE component are likely to be earned. These equity incentive awards have been recorded at the grant date fair value of $91.19 per share, which is based on the closing price on February 25, 2019, the grant date. We also evaluated the likelihood of earning the TSR component for this performance period. We first determined the aggregate fair value of the award using a Black-Scholes model. The Company's TSR was then compared to the TSR of companies in our performance peer group using a Monte Carlo stock simulation. The Monte Carlo stock simulation estimated a percentile ranking for the TSR component of greater than 53%, representing a 100% payout. For the 2019-2021 performance period, the performance share fair value of $101.70 was generated from the Black-Scholes model and used to calculate the aggregate grant date value of this component of the award. The number of actual performance shares earned will range from 0% to 200% of the target performance shares depending on actual performance as compared to the performance goals. |
2019-2020 Transitional Equity Incentive Plan | 2019-2021 Transitional Equity Incentive Plan | ||||||||||||||
| Estimated Future Payouts Under Equity Incentive Plan Awards | Grant Date Fair Value(1) | Estimated Future Payouts Under Equity Incentive Plan Awards | Grant Date Fair Value(2) | ||||||||||||
| EXECUTIVE NEO | Grant Date | Threshold 50% | Target 100% | Maximum 200% | Threshold 50% | Target 100% | Maximum 200% | ||||||||
| Jeffry M. Householder | 12/3/2019 | 2,032 | 4,064 | 8,128 | $ | 609,874 | 2,032 | 4,064 | 8,128 | $ | 603,866 | ||||
| James F. Moriarty | 12/3/2019 | 384 | 768 | 1,536 | $ | 115,252 | 384 | 768 | 1,536 | $ | 114,116 | ||||
| Beth W. Cooper | 12/3/2019 | 349 | 697 | 1,394 | $ | 104,597 | 349 | 697 | 1,394 | $ | 103,567 | ||||
| Kevin J. Webber | 12/3/2019 | 642 | 1,284 | 2,568 | $ | 192,687 | 642 | 1,284 | 2,568 | $ | 190,788 | ||||
1 | For the transitional Equity Incentive Plan for the 2019-2020 performance period, we calculated the aggregate grant date fair value of the performance-based equity incentive awards based on the estimated compensation costs on the grant date. We estimated that 200% of the Growth in Long-Term Earnings component and 186% of the ROE component are likely to be earned. These equity incentive awards have been recorded at the grant date fair value of $91.48 per share, which is based on the closing price on December 3, 2019, the grant date. We also evaluated the likelihood of earning the TSR component for this performance period. We first determined the aggregate fair value of the award using a Black-Scholes model. The Company's TSR was then compared to the TSR of companies in our performance peer group using a Monte Carlo stock simulation. The Monte Carlo stock simulation estimated a percentile ranking for the TSR component of greater than 52%, representing a 100% payout. For the 2019-2020 performance period, the performance share fair value of $88.26 was generated from the Black-Scholes model and used to calculate the aggregate grant date value of this component of the award. The number of actual performance shares earned will range from 0% to 200% of the target performance shares depending on actual performance as compared to the performance goals. |
2 | For the transitional Equity Incentive Plan for the 2019-2021 performance period, we calculated the aggregate grant date fair value of the performance-based equity incentive awards based on the estimated compensation costs on the grant date. We estimated that 200% of the Growth in Long-Term Earnings component and 178% of the ROE component are likely to be earned. These equity incentive awards have been recorded at the grant date fair value of $91.48 per share, which is based on the closing price on December 3, 2019, the grant date. We also evaluated the likelihood of earning the TSR component for this performance period. We first determined the aggregate fair value of the award using a Black-Scholes model. The Company's TSR was then compared to the TSR of companies in our performance peer group using a Monte Carlo stock simulation. The Monte Carlo stock simulation estimated a percentile ranking for the TSR component of greater than 51%, representing a 100% payout. For the 2019-2021 performance period, the performance share fair value of $91.87 was generated from the Black-Scholes model and used to calculate the aggregate grant date value of this component of the award. The number of actual performance shares earned will range from 0% to 200% of the target performance shares depending on actual performance as compared to the performance goals. |
CHESAPEAKE UTILITIES CORPORATION - 20172020 Proxy Statement - 45
Comparative Information Relating to Compensation of our Chief Executive Officer and Compensation of all Employees of the Company
We are providing the following information to comply with Section 953(b) of the Dodd-Frank Wall Street Reform and Consumer Protection Act, and Item 402(u) of Regulation S-K. For 2019, our last completed fiscal year, the median of the annual total compensation of our employees was $78,064. The annual total compensation for Mr. Householder for 2019 was as reported in the Summary Compensation Table, was $3,341,011, which includes a one-time transitional equity grant in 2019 in connection with his promotion to Chief Executive Officer. Excluding the one-time grant, Mr. Householder's annual total compensation was $2,127,271. Based on this information, for 2019, the estimate of the ratio of compensation for our Chief Executive Officer to the median employee was 43 to 1 and, excluding the one-time transitional grant the ratio of compensation would be 27 to 1. This ratio is specific to our Company and may not be comparable to any ratio disclosed by another company.
As permitted by Item 402(u) of Regulation S-K, we used the same median employee in 2019 as we used in 2018, as our employee population and employee compensation arrangements in 2019 did not significantly change from 2018. Among other factors, the philosophy and design of our compensation program, the size and geographic diversity of our employee base, and the diversity of our business operations is consistent for 2019 as compared to 2018. We identified the median employee in 2017 by reviewing compensation reflected in our payroll records as reported to the Internal Revenue Service on Form W-2 for our 938 employees as of December 31, 2017 for purposes of determining pay ratio, which includes employees of companies we acquired during the year. We annualized the compensation of these and other full-time employees who joined the Company in 2017 but did not work for us for the entire fiscal year. Based on the diversity of our businesses across our service territories, W-2 earnings provide a fixed and fair representation of compensation across our enterprise and thus are an appropriate measure to determine the median employee. No other assumptions, adjustments, or estimates, including any cost-of-living adjustments, were made in identifying the median employee. We next calculated the median employee’s annual total compensation in accordance with the requirements of Item 402(c)(2)(x) of Regulation S-K for the Summary Compensation Table, consistent with the calculations we provide for all of our NEOs. No adjustments were made to the annual total compensation of our Chief Executive Officer, as reported in the Summary Compensation Table, to calculate the reported ratio of the annual total compensation of our Chief Executive Officer to the median of the annual total compensation of all employees.
Outstanding Equity Incentive Awards
| Named Executive Officer | Equity Incentive Plan Awards: Number of Unearned Shares, Units or Other Rights That Have Not Vested(1) | Equity Incentive Plan Awards: Market or Payout Value of Unearned Shares, Units, or Other Rights That Have Not Vested(2) | |
| (#) | ($) | ||
| Michael P. McMasters | 27,400 | 1,834,430 | |
| Stephen C. Thompson | 11,524 | 771,532 | |
| Beth W. Cooper | 10,437 | 698,757 | |
| Elaine B. Bittner | 9,767 | 653,901 | |
| Jeffry M. Householder | 10,115 | 677,199 | |
| OUTSTANDING EQUITY AWARDS FOR THE NEOs AT DECEMBER 31, 2019 | ||||||
Executive NEO(1) | Equity Incentive Plan Awards: Number of Unearned Shares, Units or Other Rights That Have Not Vested(2) | Equity Incentive Plan Awards: Market or Payout Value of Unearned Shares, Units, or Other Rights That Have Not Vested(3) | ||||
| Jeffry M. Householder | 36,078 | $ | 3,457,355 | |||
| James F. Moriarty | 15,324 | $ | 1,468,499 | |||
| Beth W. Cooper | 15,200 | $ | 1,456,616 | |||
| Kevin J. Webber | 9,392 | $ | 900,035 | |||
1 | Mr. Thompson was not included in this table because he retired effective December 31, 2019. The Compensation Committee will determine the achievement of equity incentive grants made to the Mr. Thompson for the 2018 Equity Incentive Award and the 2019 Equity Incentive Award upon consideration of pre-established performance targets for the 2018-2020 and 2019-2021 performance periods. Mr. Thompson will be eligible for a prorata portion of the target shares, based on his service during the performance period. |
2 | The share |
3 | The market value represents the unearned shares multiplied by |
CHESAPEAKE UTILITIES CORPORATION - 2020 Proxy Statement - 46
Pension Plans
We maintain two defined benefit pension plans (one tax-qualified and one excess, non-qualified plan) that include named executive officersNEOs as provided below. Both plans were frozen effective January 1, 2005. On that date all benefits became fully vested and no further benefit accruals have occurred.occurred thereafter. In 2019, the Committee received updates on the Company's Pension Plan de-risking strategy after approval by the Board.
The Pension Plan is a tax qualified plan that was formerly available to all eligible employees and provides benefits based on a formula that yields a monthly amount payable over the participant’s life. Benefits from the Pension Plan are paid from the Pension Plan’s trust, which is funded solely by the Company. Messrs. McMasters and Thompson and Ms. Cooper have vested benefits in the Pension Plan.
The Pension SERP provides benefits based on the Pension Plan formula applied to compensation and benefits in excess of IRS limits. The Pension SERP is unfunded, but is required to be funded in the event of a change in control of the Company. Messrs. McMasters and Thompson have vested benefits in the Pension SERP.
The following table shows the present value of accumulated benefits that named executive officersMs. Cooper and Mr. Thompson are entitled to under the Pension Plan and Pension SERP:
| Name | Plan Name | Number of Years Credited Service(1) (#) | Present Value of Accumulated Benefits(2) ($) | Payments During the Last Fiscal Year ($) | |||||||||||||||||||||
Michael P. McMasters(3) | Pension Plan | 25 | 770,219 | 0 | |||||||||||||||||||||
| PRESENT VALUE OF NEO ACCUMULATED BENEFITS UNDER THE PENSION PLAN AND PENSION SERP | PRESENT VALUE OF NEO ACCUMULATED BENEFITS UNDER THE PENSION PLAN AND PENSION SERP | ||||||||||||||||||||||||
| Pension SERP | 25 | 201,272 | 0 | ||||||||||||||||||||||
| Pension Plan | Pension SERP | ||||||||||||||||||||||||
Number of Years Credited Service(1) | Present Value of Accumulated Benefits(2) | Payments During the Last Fiscal Year | Number of Years Credited Service(1) | Present Value of Accumulated Benefits(2) | Payments During the Last Fiscal Year | ||||||||||||||||||||
| NEO | |||||||||||||||||||||||||
Beth W. Cooper(3) | 17 | $ | 232,414 | $ | — | — | $ | — | $ | — | |||||||||||||||
Stephen C. Thompson(3) | Pension Plan | 24 | 656,297 | 0 | 24 | $ | 902,762 | $ | — | 24 | $ | 220,744 | $ | — | |||||||||||
| Pension SERP | 24 | 177,457 | 0 | ||||||||||||||||||||||
Beth W. Cooper(3) | Pension Plan | 17 | 149,621 | 0 | |||||||||||||||||||||
1 | Number of years of service equals total service from date of employment until the plans were frozen. Additionally, on December 31, 2004, in conjunction with the freezing of the Pension Plan and the Pension SERP, each employee participating in such plans was credited with an additional two years of service. Since the Plans are now frozen, service and compensation on or after January 1, 2005 will not affect the benefits available to any participant. Due to the additional two years of credited service, the monthly accrued benefit payable at normal retirement age from the Pension Plan increased as follows: |
2 | Actuarial present value is based on assumptions and methods used to calculate the benefit obligation under standards established by the Financial Accounting Standards Board (see Note |
•Discount rate equal to 3.75%3% as of December 31, 2016;2019;
•Mortality rates based on the RP-2014Pri-2012 Total Dataset Mortality Table (adjusted to 2006) with MP-2016 Mortality Improvement Scale;Scale MP-2019;
•Long-term rate of return on Pension Plan assets equal to 6.0%3.5%;
•Annuity at normal retirement (age 65) except for Mr. McMasters’ Pension SERP which assumes a lump sum payment at age 65;; and
"Final Average EarningsEarnings" equal to the average of Adjusted"Adjusted W-2 EarningsEarnings" during the highest 60 consecutive months taken from the last 120 months before December 31, 2004, when the Plansplans were frozen. Adjusted W-2 Earnings are comprised of W-2 compensation, less performance-based share awards, plus salary deferrals, less fringe benefits. The Internal Revenue Code places limits on annual benefit amounts and annual compensation that can be considered under the Pension Plan; the Pension SERP provides the executive with a benefit as if the limits did not exist. Final Average Earnings used to compute the benefit amounts were as follows: Mr. McMasters $293,565; Mr. Thompson $273,815;- $273,815 and Ms. Cooper - $116,342. The annual benefits that may be paid and the amount of annual compensation that will be considered in connection with the Pension SERP are based on IRS limitations for 2004, which are $165,000 and $205,000, respectively.
3 |
Under the Pension Plan and Pension SERP, participants are entitled to receive benefits at the normal retirement age of 65, based upon Final Average Earnings (defined in footnote 2 above) and credited years of service (described in footnote 1 above). The Pension Plan provides a benefit up to the IRS limits and the Pension SERP provides a benefit for additional amounts that would have been earned if the IRS limits did not exist. The accrued monthly benefit for each named executive officerNEO is determined by calculating one-twelfth of the annual amount of (i) plus (ii), multiplied by (iii):
| (i) |
| (ii) |
| (iii) | Credited years of service (but not more than 35 years) |
A participant may elect to receive a reduced early retirement benefit beginning at age 55. The early retirement benefit equals the normal retirement benefit reduced by one-fifteenth for each of the first five years, and one-thirtieth for each of the next five years by which the annuity start date precedes the normal retirement date.
For the Pension Plan, the normal form of benefit for a married employee is a joint and survivor annuity. The normal form of benefit for a single employee is a life annuity. Other forms of benefits may be elected, including a lump sum payment. Benefits under the qualified Pension Plan and Pension SERP are not subject to any deduction for Social Security or other offset amounts. The Pension Plan and Pension SERP also include provisions for benefits that the participant’s beneficiary or spouse would be entitled to in the event of death or disability.
CHESAPEAKE UTILITIES CORPORATION - 20172020 Proxy Statement - 47
Non-Qualified Deferred Compensation Plan
NEOs to defer:
The Non-Qualified Deferred Compensation Plan is required to comply with Internal Revenue Code Section 409A and procedures established by the Compensation Committee. The requirements include advance elections of deferral amounts. Additionally, participants must select a distribution date and form of distribution at the time of the deferral election. Distributions can be made in a single payment or in annual installments over 2-15 years (prior to January 1, 2014, installments were allowed over 5 or 10 years). The named executive officersNEOs will not be entitled to receive any payments until six months after his or her date of separation, except under certain circumstances. Payments to the participant may be accelerated in the event of death, disability, change in control, or an unforeseeable emergency. Participants will be individually responsible for any tax obligations related to deferring compensation under the Non-Qualified Deferred Compensation Plan. Distributions of deferrals of cash compensation will be paid in cash, while distributions of deferred stock units will be paid in common stock.
All of the named executive officersNEOs participated in the Non-Qualified Deferred Compensation Plan.Plan during 2019. The following table reflects the aggregate balance of non-qualified deferred compensation for each named executive officer.NEO.
| Non-qualified Deferred Compensation for the 2016 Fiscal Year | |||||
Executive Deferrals in 2016 ($) | Registrant Contributions in 2016(1) ($) | Aggregate Earnings in 2016(2)(3) ($) | Aggregate Withdrawals/ Distributions in 2016 ($) | Aggregate Balance at December 31, 2016 ($) | |
| Michael P. McMasters | 38,466 | 45,061 | 567,926 | (3,222) | 3,690,903 |
| Stephen C. Thompson | 46,167 | 22,951 | 64,273 | 0 | 738,935 |
| Beth W. Cooper | 141,938 | 18,820 | 185,594 | 0 | 1,374,076 |
| Elaine B. Bittner | 96,236 | 15,967 | 50,947 | 0 | 508,884 |
| Jeffry M. Householder | 305,998 | 23,220 | 57,329 | 0 | 813,096 |
| NON-QUALIFIED DEFERRED COMPENSATION FOR THE 2019 FISCAL YEAR | |||||||||||||||||||||
Executive Deferrals in 2019 | Registrant Contributions in 2019(1) | Aggregate Earnings in 2019(2)(3) | Aggregate Withdrawals/ Distributions in 2019 | Aggregate Balance at December 31, 2019 | |||||||||||||||||
| Jeffry M. Householder | $ | 360,289 | $ | 37,077 | $ | 341,030 | $ | 0 | $ | 2,056,909 | |||||||||||
| James F. Moriarty | $ | 140,066 | $ | 34,235 | $ | 15,609 | $ | 0 | $ | 194,456 | |||||||||||
| Beth W. Cooper | $ | 383,919 | $ | 22,226 | $ | 521,240 | $ | (39,864 | ) | $ | 3,090,917 | ||||||||||
| Kevin J. Webber | $ | 98,790 | $ | 14,127 | $ | 106,819 | $ | 0 | $ | 699,713 | |||||||||||
| Stephen C. Thompson | $ | 50,527 | $ | 22,584 | $ | 201,622 | $ | 0 | $ | 1,249,363 | |||||||||||
1 | Represents our matching and supplemental contributions associated with the Deferred Compensation Plan. These dollars are included in the All Other Compensation column of the Summary Compensation Table. |
2 | The investment options available under the |
3 | Dividends on deferred stock units in the |
Those amounts, as well as similar awards reported in the Summary Compensation Tables in prior years and matching contributions into the Company’s Non-Qualified Deferred Compensation Plan previously reported in the Summary Compensation Tables in prior years under All Other Compensation,, are included in the Aggregate Balance at December 31, 20162019 column and quantified below:
| Name | Amount included in both Non-Qualified Deferred Compensation Table and Summary Compensation Table | Amount included in both Non-Qualified Deferred Compensation Table and previously reported in Prior Years’ Summary Compensation Tables | ||||||||
| Jeffry M. Householder | $ | 397,366 | $ | 959,945 | ||||||
| James F. Moriarty | $ | 174,301 | $ | 2,729 | ||||||
| Beth W. Cooper | $ | 406,145 | $ | 1,712,293 | ||||||
| Kevin J. Webber | $ | 112,918 | $ | 0 | ||||||
| Stephen C. Thompson | $ | 73,110 | $ | 569,638 | ||||||
CHESAPEAKE UTILITIES CORPORATION - 20172020 Proxy Statement - 48
| Name | Amount included in both Non-Qualified Deferred Compensation Table and Summary Compensation Table ($) | Amount included in both Non-Qualified Deferred Compensation Table and previously reported in Prior Years’ Summary Compensation Tables ($) |
| Michael P. McMasters | 83,527 | 1,086,106 |
| Stephen C. Thompson | 69,118 | 382,433 |
| Beth W. Cooper | 160,758 | 897,414 |
| Elaine B. Bittner | 112,203 | 234,750 |
| Jeffry M. Householder | 329,218 | 315,595 |
Termination Provisions
Each of the named executive officer’s employment agreement contains a clawback provision. Under the clawback provision that provides that all or any portion of an incentive award under the 2015 Cash Plan and 2013 Equity PlanSICP or any future arrangement established by the Company iswas subject to repayment by the named executive officer,NEO, if the award was calculated based upon the achievement of certain financial results or other performance metrics that, in either case, were subsequently found to be materially inaccurate. If the Compensation Committee determinesdetermined that the named executive officerNEO engaged in misconduct, malfeasance or gross negligence in the performance of his or her duties that either caused or significantly contributed to the material inaccuracy in financial statements or other performance metrics, there is no time limit on this right of recovery. In all other circumstances, the right of recovery is limited to one year after the date of payment of each award. The right of recovery of payments automatically terminates upon a change in control except with respect to any right of recovery that hashad been asserted prior to such change in control.
Potential Payments Upon Termination or DeathDeath. . IfUnder the employment agreements, if the Company terminates or elects to not renew a named executive officer’san NEO's employment agreement at the end of the term of the agreement for any reason other than his or her death or “for cause,” as specifically defined in the employment agreements, or the named executive officer’s death, then the named executive officer isNEO would be entitled to receive, as severance compensation, his or her then monthly base compensation for one year after the termination date. The named executive officer’s compensation may be decreased provided that the decrease is made on a good faith basis and with reasonable justification. Termination for any reason other than “for cause” can also be referred to as termination “without cause” and can be initiated by either the named executive officer or the Company. Generally, termination “without cause” can occur when the Company acting in good faith, decreases a named executive officer’s position,“for cause,” termination due to the death, or resignation of the NEO generally does not entitle the NEO to any severance compensation or benefits at which timebut only to the named executive officer may terminate his or her employment for “good
Potential Payments Upon a Change in Control.The employment agreements include provisions that are designed to help retain the named executive officersNEOs in the event of a change in control of the Company. The Board believes that these provisions are appropriate to address the uncertainties and potential distractions resulting from any threatened or actual change in control. In accordance with the agreements, a change in control occurs upon one of several events involving the replacement of a majority of the members of our Board, the acquisition of ownership of significant percentages of our outstanding stock, or the acquisition of a significant assetsportion of the Company.our assets.
•Current monthly base compensation multiplied by 24 (multiplied by 36 for Mr. McMasters).the Chief Executive Officer)
Average of the cash incentive awards paid over the prior three calendar years, multiplied by two (multiplied by three for Mr. McMasters).the Chief Executive Officer)
Generally, resignation by a NEO “with good reason” can occur when the Company decreases a NEO's position, responsibility, compensation or benefits, and does not cure the change after notice from the NEO. Upon a change in control, each named executive officer’sNEO's monthly base compensation may increase by such amounts as the Board may determine from time to time based, in part, on an annual review of the named executive officers’NEOs’ compensation and performance. In no event would a named executive officer’sNEO's base compensation be decreased. Each named executive officerNEO would continue to receive health and other insurance benefits for the remainder of the term of his or her employment agreement. Under
CHESAPEAKE UTILITIES CORPORATION - 2020 Proxy Statement - 49
Pursuant to each named executive officer’sNEO’s performance share agreements, as applicable, in the event of a change in control, the executive immediately earns all unearned performance shares at the target level under the 2015-20172018 Equity Incentive Award for Messrs. Householder and 2016-2018Moriarty and Ms. Cooper. In the event of a change in control, Mr. Webber would immediately earn his unearned target cash incentive award for the 2018-2020 performance period. The Executive NEOs would also earn all unearned performance shares at the target level under the 2019 Equity Incentive Award agreements (or the applicable prorata portion during service with the Company), 2019-2020 transitional equity incentive award agreements, and the 2019-2021 transitional equity incentive award agreements. In addition, each named executive officerNEO would receive any benefits that he or she otherwise would have been entitled to receive under our 401(k)Retirement Savings Plan and Non-Qualified Deferred Compensation Plan, as of the date of termination, although these benefits are not increased.
The total severance amount payable to a named executive officerNEO following a change in control is capped at one dollar less than the amount that would be subject to the “golden parachute” limitations under Internal Revenue Code Section 280G. As a result, no excise tax would be levied nor would there be any loss of tax deductibility to the Company as a result of making the severance payment. If the severance as computed exceeds this limitation, the amount payable will be unilaterally reduced to the amount necessary to avoid exceeding the limitations under Internal Revenue Code Section 280G.
Based upon a hypothetical termination date of December 31, 2016,2019, under the terms and conditions of the employment agreements, estimated payments or benefits in connection with a change in control, using $66.95,$95.83, the closing market price per share of our common stock on December 30, 2016,31, 2019, the last business day of 2016,2019, would have been as follows:
| Michael P. McMasters | Stephen C. Thompson | Beth W. Cooper | Elaine B. Bittner | Jeffry M. Householder | |||||||||||||||
| Base Salary (based upon severance multiple) | $ | 1,740,000 | $ | 680,000 | $ | 620,000 | $ | 610,000 | $ | 610,000 | |||||||||
Annual Cash Bonus (based upon severance multiple)1 | $ | 1,317,199 | $ | 332,080 | $ | 301,397 | $ | 257,451 | $ | 224,773 | |||||||||
Healthcare and Other Insurance Benefits2 | $ | 54,081 | $ | 36,125 | $ | 36,216 | $ | 36,256 | $ | 25,561 | |||||||||
Unpaid Equity Incentive Compensation3 | $ | 1,043,014 | $ | 444,012 | $ | 401,767 | $ | 372,912 | $ | 388,444 | |||||||||
| Total | $ | 4,154,294 | $ | 1,492,218 | $ | 1,359,380 | $ | 1,276,618 | $ | 1,248,777 | |||||||||
Reduced to Not Exceed the IRC 280G Limit4 | $ | (58,217 | ) | — | — | — | — | ||||||||||||
| Net Amount Payable to Executive | $ | 4,096,077 | $ | 1,492,218 | $ | 1,359,380 | $ | 1,276,618 | $ | 1,248,777 | |||||||||
ESTIMATED PAYMENTS OR BENEFITS TO EXECUTIVE NEOs IN CONNECTION WITH A CHANGE IN CONTROL(1) | ||||||||||||||||
Jeffry Householder | James Moriarty | Beth Cooper | Kevin Webber | |||||||||||||
Base Salary (based upon severance multiple) | $ | 1,800,000 | $ | 770,000 | $ | 770,000 | $ | 550,000 | ||||||||
Cash Bonus (based upon severance multiple)(2) | $ | 316,929 | $ | 199,564 | $ | 192,890 | $ | 158,298 | ||||||||
Healthcare and Other Insurance Benefits(3) | $ | 40,864 | $ | 22,122 | $ | 37,137 | $ | 52,397 | ||||||||
Unpaid Equity or Long-Term Cash Incentive Compensation(4) | $ | 1,728,677 | $ | 734,249 | $ | 728,308 | $ | 525,018 | ||||||||
| Total | $ | 3,886,470 | $ | 1,725,935 | $ | 1,728,335 | $ | 1,360,713 | ||||||||
Reduced to Not Exceed the IRC 280G Limit (5) | $ | (2,235,098 | ) | $ | (143,374 | ) | $ | (246,822 | ) | $ | (614,881 | ) | ||||
| Net Amount Payable to Executive | $ | 1,651,372 | $ | 1,582,561 | $ | 1,481,513 | $ | 745,832 | ||||||||
1 | Mr. Thompson was not included in this table because he retired effective December 31, 2019. |
2 | The average of the cash incentive awards under the 2015 Cash Plan (or any predecessor plan) for |
3 | Based upon the expected healthcare cost per employee for |
4 | This represents the target equity awards under the |
5 | The total severance amount payable to a |
Upon a change in control, each named executive officer would beNEO is entitled to receive the amounts deferred under the Non-Qualified Deferred Compensation Plan, in the form of a lump sum payment.
In accordance with the Treasury Regulations issued under Section 409A of the Internal Revenue Code, each named executive officer’sNEO's employment agreement provides that if a separation from service occurs: (i) within two years of a change in control, severance benefits willwould be paid in a lump sum, or (ii) more than two years after the change in control, the benefits willwould be paid in equal installments over a one year period. In addition, each employment agreement provides that benefits paid upon a separation from service willwould be subject to a six-month delay in the commencement of payment if required by Section 409A of the Internal Revenue Code. The named executive officer willNEO would pay the full amount for benefits extended during the six-month delay period (to be reimbursed by the Company with interest) if this delay provision applies.
Equity Compensation Plan Information
As of December 31, 2016,2019, there were 736,033725,262 shares reserved under the Company’sCompany's Dividend Reinvestment and Direct Stock Purchase Plan, 831,183 shares reserved for issuance under the Company’sCompany's Retirement Savings Plan, and 539,374449,868 shares reserved for issuance under the Company’sCompany's SICP. The SICP was approved by our stockholders in 2013 Equity Plan.and amended by the Compensation Committee in January 2017. There are no outstanding options, warrants or rights under these plans.
CHESAPEAKE UTILITIES CORPORATION - 2020 Proxy Statement - 50
Compensation Committee Interlocks and Insider Participation
Dianna F. Morgan, Chair, Ronald G. Forsythe, Jr., Dennis S. Hudson, III and Calvert A. Morgan, Jr. serve as members of the Compensation Committee of the Board.Committee. Each member of the Compensation Committee is independent as required by the NYSE Listing Standards. No member of the Compensation Committee, at any time, has been employed by the Company, or been a participant in a related person transaction with the Company. There were no Compensation Committee interlocks or insider (employee) participation during 2016.2019.
8 - OTHER RELEVANTIMPORTANT INFORMATION
Quorum
A quorum must be present in order for business to be conducted at the Annual Meeting. A quorum consists of a majority of the shares of common stock outstanding on our record date. Shares represented at the Meeting in person or by proxy will be counted in determining whether a quorum exists. If you abstain or withhold your vote, your shares will be treated as present and entitled to vote in determining the presence of a quorum. Broker non-votes will be counted as present at the Meeting for quorum purposes, but not voted. The Company’sCompany's Inspector of Elections will tabulate the votes and determine whether a quorum is present.
Soliciting Proxies
The Company will pay all costs relating to the solicitation of proxies. We have hired Georgeson LLC, a proxy solicitation firm, to assist us in soliciting proxies for a fee of $9,000$9,500 plus reasonable expenses. Proxies may be solicited by our directors, officers and employees by personal interview, mail, telephone or e-mail. In addition, we may engage other consultants at our expense to solicit proxies. The Notice of Annual Meeting of Stockholders, this Proxy Statement, and the enclosed proxy card are being furnished to our stockholders on or about April 10, 2017.
Revoking a Proxy
You may revoke your proxy at any time before voting is declared closed at the Meeting by: (i) voting at the Meeting in person;Meeting; (ii) executing and delivering a subsequent proxy; (iii) submitting another timely and later dated proxy by telephone or the internet; or (iv) delivering a written statement to the Corporate Secretary of the Company revoking the proxy.
Householding
Stockholders of record who have the same last name and address and who request paper copies of the proxy materials or Annual Report will receive only one copy of the proxy materials. Brokers and banks that hold our stock on your behalf may provide you with one copy of the proxy materials and Annual Report if the bank or broker is aware that more than one stockholder at your address have the same last name or they reasonably believe that the stockholders are members of the same family. If you receive a notice from your broker or bank stating that they intend to send only one copy of the proxy materials to your address, and members of your household do not object, then you will have consented to this arrangement. Stockholders of record that received one copy of the proxy statement or Annual Report as a result of householding may request to receive separate copies of these materials by contacting the Corporate Secretary at Chesapeake Utilities Corporation, 909 Silver Lake Boulevard, Dover, Delaware 19904 or (888) 742-5275. If your shares are held through a broker or bank, you should contact the broker or bank directly to request multiple copies of the proxy statement and Annual Report.
Stockholder Proposals
To be considered for inclusion in our proxy statement mailed in 2018,2021, stockholder proposals must be received in writing at our principal executive offices on or before November 30, 2017.before December 2, 2020. Stockholder proposals should be directed to the Corporate Secretary at Chesapeake Utilities Corporation, 909 Silver Lake Boulevard, Dover, Delaware 19904. A stockholder wishing to bring business before stockholders at the 20182021 Annual Meeting must provide written notice to the Corporate Secretary. The notice must be received by the Company at its principal executive offices not earlier than the close of business on the 120th day and not later than the close of business on the 90th day prior to the first anniversary of the 20172020 Meeting. In the event that our annual meeting is more than 30 days before or more than 60 days after such anniversary date, you should refer to our Bylaws for specific requirements. In accordance with our Bylaws, a stockholder’s notice must include, among other things, a description of the business to be brought before the meeting, Ownership and Rights Information (as defined in our Bylaws), and any other information that would be required to be made in connection with the solicitation of proxies. A stockholder’s notice must also include a representation as to the accuracy of the information that is being provided. We have provided additional information on page 22 onin the submissionBoard of stockholder proposals for director nominees.Directors section of this Proxy Statement under subsection Director Nominations.
Annual Report on Form 10-K
At your request, the Companywe will provide, without charge, a copy of our 20162019 Annual Report to Shareholders which contains our Annual Report on Form 10-K for the year ended December 31, 2016.2019. The Annual Report provides financial information to our stockholders. The Annual Report is not, and shall not be considered, “soliciting material,” or be “filed” with the SEC nor shall this information be subject to the liabilities of Section 18 of the Securities Exchange Act of 1934, as amended. Please direct all written requests to the Corporate Secretary, Chesapeake Utilities Corporation, 909 Silver Lake Boulevard, Dover, Delaware 19904.
CHESAPEAKE UTILITIES CORPORATION - 20172020 Proxy Statement - 5351